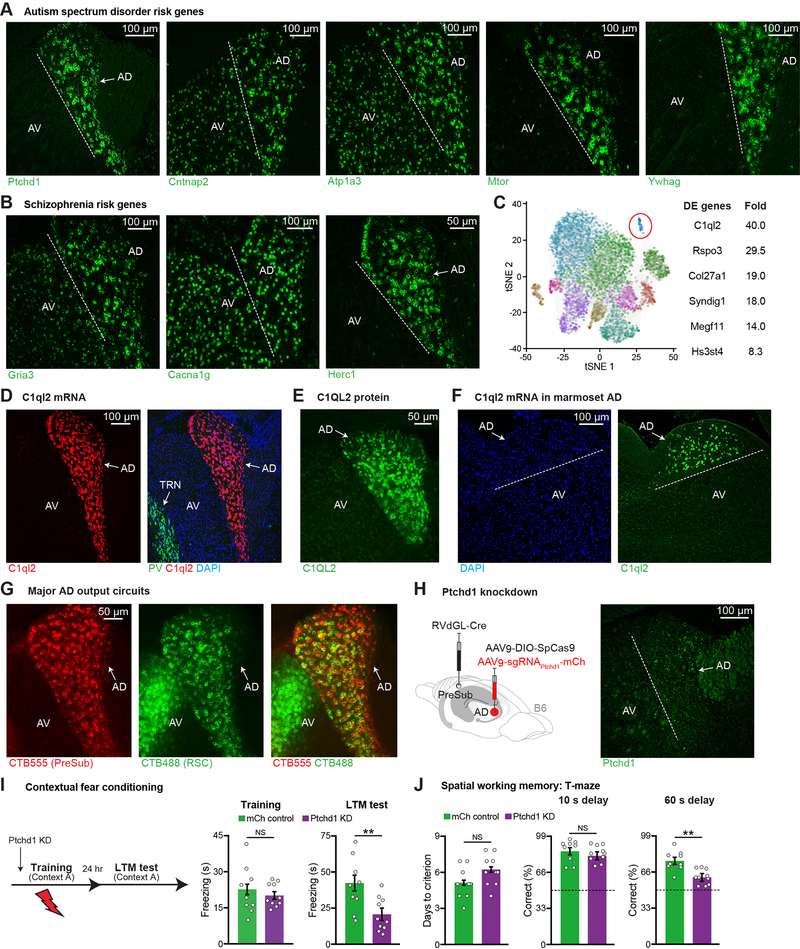
Figure 1. Memory Impairments in AD Thalamus-Specific PTCHD1 Knockdown Mice.
(A-B) FISH staining of ASD (A), schizophrenia risk genes (B), in ATN. Anterodorsal (AD), anteroventral (AV).
(C) 11 excitatory neuron clusters in mouse thalamus from DropViz (89,027 cells, n = 6 mice) (left), top differentially expressed (DE) genes from the highlighted cluster (right). Rspo3 (R-spondin 3), Col27a1 (collagen type XXVII alpha 1 chain), Syndig1 (synapse differentiation inducing 1), Megf11 (multiple EGF like domains 11), Hs3st4 (heparan sulfate-glucosamine 3-sulfotransferase 4).
(D) FISH staining in ATN, parvalbumin (PV) neurons in TRN, DAPI staining (blue).
(E) Antibody staining in ATN.
(F) FISH staining in marmoset ATN.
(G) Retrograde CTB labeling from PreSub or RSC in ATN. Average of 296 CTB555+ and 271 CTB488+ cells were observed in AD. 84% of all PreSub-projecting neurons send collaterals to RSC (n = 3 mice).
(H) Circuit-based PTCHD1 knockdown (KD) strategy (left), FISH staining after KD (right). Ptchd1 expression is decreased by 96% (fluorescence intensity) in KD mice as compared to mCh controls in Figure S1H (n = 3 mice per group).
(I) CFC behavior. mCh control mice received an AAV expressing mCherry in AD in place of the AAV expressing sgRNAs. Long-term memory (LTM) recall test (mCh n = 9, KD n = 10 mice).
(J) T-maze behavior (mCh n = 9, KD n = 10 mice). Dashed line indicates chance level (50% correct).
Dashed line indicates the border between AD and AV. Two-tailed unpaired t test (I, J). For statistical comparisons, **p < 0.01; NS, not significant.
Data are presented as mean ± SEM.

