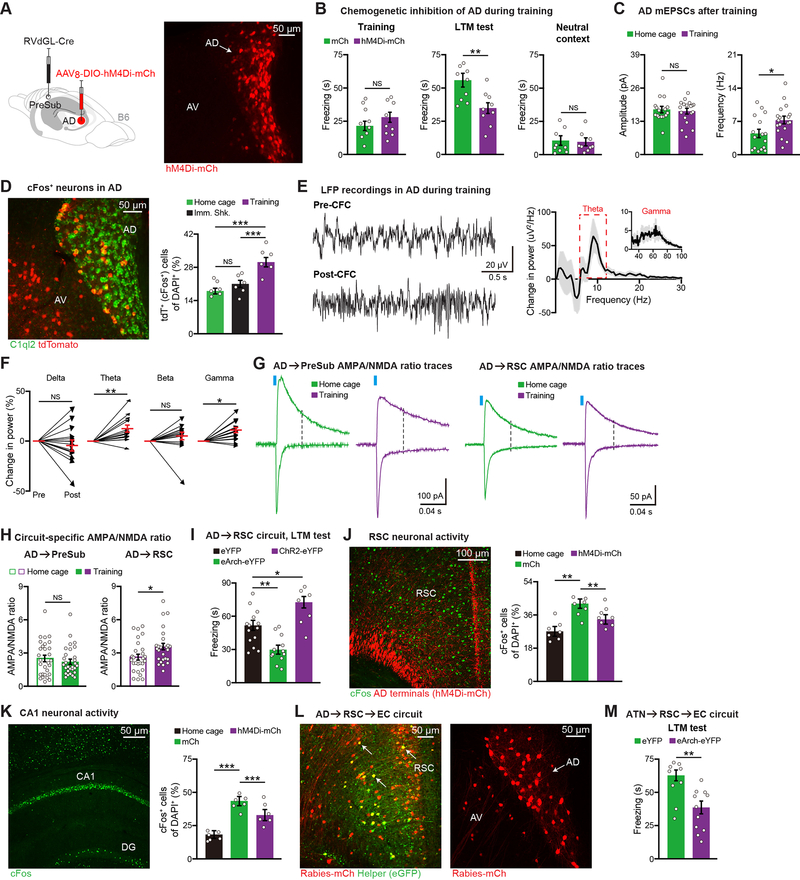
Figure 4. The AD→RSC→EC Circuit is Necessary for Contextual Memory Encoding.
(A) hM4Di expression in AD.
(B) CFC behavior (n = 9 mice per group). mCherry control (mCh) mice received a Cre-dependent mCherry virus in place of the hM4Di virus.
(C) mEPSCs of AD neurons from home cage (16 neurons) or CFC training (18 neurons) groups (n = 3 mice per group).
(D) Activity of AD neurons using Fos-TRAP mice (n = 6 mice per group). Immediate shock (Imm. Shk.). AD neurons revealed by C1QL2 staining.
(E-F) LFP traces before (Pre) vs. after (Post) CFC training, change in LFP power after training
(E), change in power for individual frequency bands (F) (n = 15 mice).
(G-H) AMPA/NMDA ratio recordings of AD circuits, representative traces (G), quantification
(H) (AD→PreSub: 29 neurons per group, AD→RSC: 27 home cage and 26 training neurons, n = 3 mice per group).
(I) Optogenetic terminal inhibition (eArch-eYFP, n = 12 mice) or activation (ChR2-eYFP, n = 7 mice) during CFC training. Control (eYFP, n = 14 mice). LTM test is plotted.
(J-K) cFos staining in RSC using home cage (n = 7 mice), training control (mCherry or mCh, n = 7 mice), training AD hM4Di-mCh (n = 8 mice) groups (J), cFos staining in hippocampal CA1
(K) (n = 6 mice per group). Both mCh and hM4Di-mCh groups received C21 injections prior to training. Dentate gyrus (DG).
(L) Two-step RV tracing showing AD, AV inputs to entorhinal cortex (EC)-projecting RSC neurons. Starters (yellow) in RSC (left image), upstream ATN labeling (right image).
(M) Optogenetic terminal inhibition of EC-projecting RSC neurons, which receive ATN input, during training (eYFP n = 9 mice, eArch-eYFP n = 11 mice).
Two-tailed unpaired t test (B-C, H, M), paired t test (F), and one-way ANOVA followed by Bonferroni post-hoc test (D, I-K). For statistical comparisons, *p < 0.05, **p < 0.01, ***p < 0.001; NS, not significant.
Data are presented as mean ± SEM.

