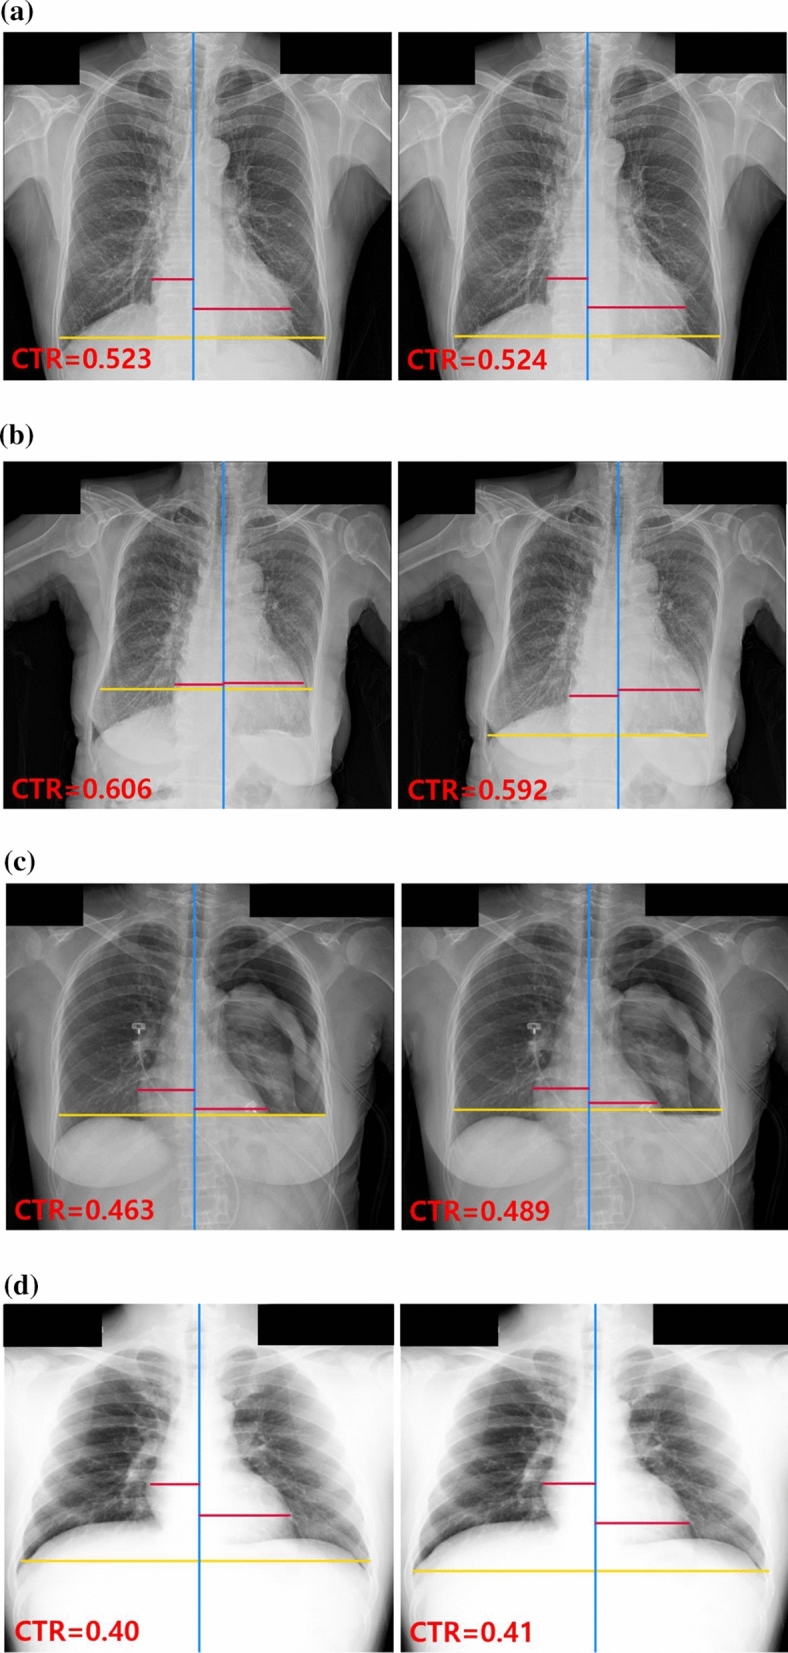
Figure 2.

Radiographs of correctly classified examples. CTR values and three lines were generated by segmentation-based methods using deep learning models for the detection of cardiomegaly. The red lines represent the maximum transverse diameter of the left or right side of the heart, respectively; the yellow and blue lines represent the transverse thoracic diameter and the midline of the spine, respectively. For each case, the left image was generated by segmentation-based method 1, and the right image was generated by segmentation-based method 2. (a) PA CXR of a patient with cardiomegaly (reference standard [RS] = 0.522); (b) PA CXR of a patient with cardiomegaly and pleural effusion (RS = 0.611); (c) PA CXR of a patient with pneumothorax, pleural effusion, and left lung collapse, (RS = 0.466); (d) PA CXR of a patient with no finding (RS = 0.41). CTR cardiothoracic, PA CXR posterior-anterior chest X-ray.
