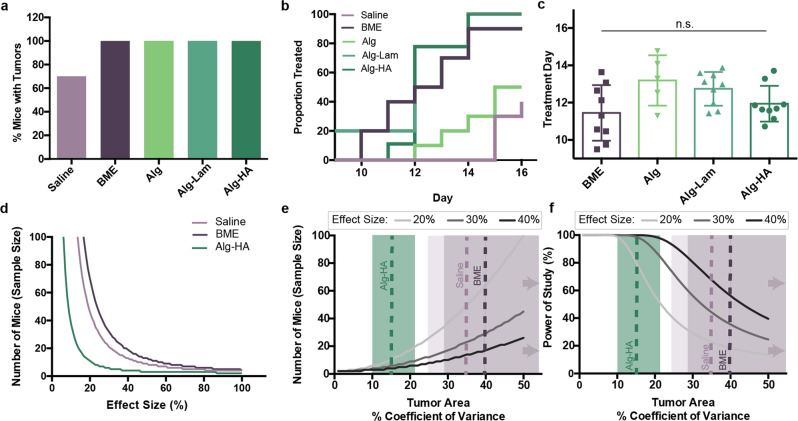
Fig. 3. Statistical evaluation of tumor growth, treatment, and power.
a Percentage of mice that formed palpable tumors during the 15-day experiment. b Treatment day analysis from interpolation assuming exponential growth. Proportion treated from each group over time. c Individual points (representing each mouse’s treatment day) plotted with average and standard deviation. d Power analysis predicting the number of mice per group needed based off the experimental data obtained with 80% power. The Statistical toolbox in Matlab was used for power calculations, specifically the sampsizepwr function with two-sided t-tests. The average and distribution of the day that each formulation surpassed 100 mm2 were used in the power analysis. e Power analyses predicting the effect of the tumor area %CV on the number of mice needed per group to obtain 80% power. Dotted lines represent %CV found from experimental formulations. Shading represents the area encompassing the 95% confidence intervals on the %CV values. The high estimate of the 95% confidence interval for both BME and saline exceed 50%. f Power analyses predicting the effect of tumor %CV on the power of the study with 10 mice per group. The dotted colored lines represent the %CV found from experimental formulations. Shading represents the area encompassing the 95% confidence intervals on the %CV values. The high estimate of the 95% confidence interval for both BME and saline exceeds 50%.

