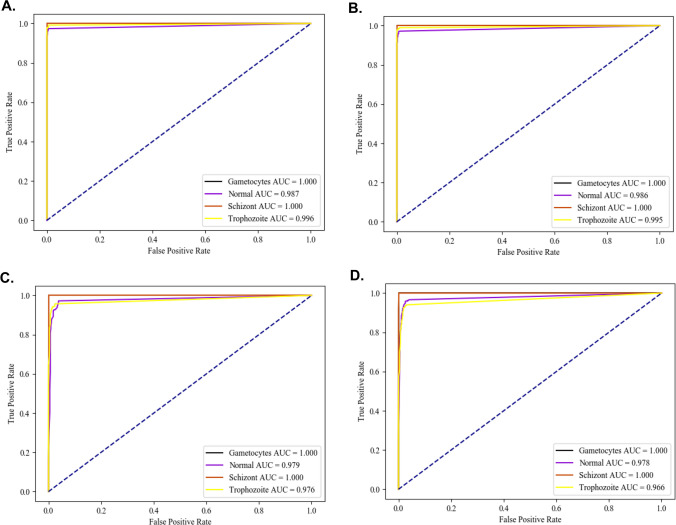
Figure 2.
The AUC under the ROC curve analyzed by the model- wise performance following; (A) Darknet, (B) Darknet19, (C) Darknet19_448 and (D) Densenet201, respectively. Besides, the plot also present class-wise comparison following; Gametocyte, Normal RBC, Schizont and Trophozoite, respectively. All images were plotted under the CiRA CORE plug-in encoded by using Python 3.5.0 (https://launchpad.net/~deadsnakes/+archive/ubuntu/ppa), matplotlib 3.4.2 (https://pypi.org/project/matplotlib/) and pandas 1.3.1 (https://pypi.org/project/pandas/).

