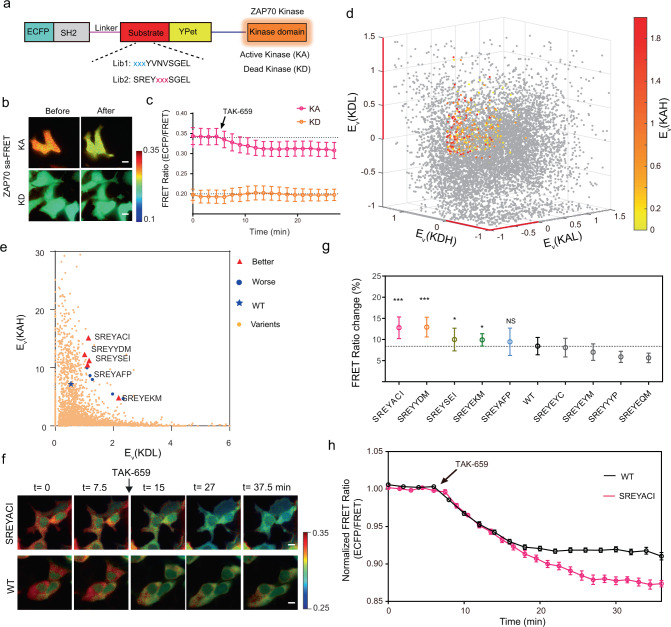
Fig. 3. Development and optimization of the ZAP70 FRET biosensor.
a Design of the self-activating ZAP70 FRET biosensor as the screening template. b–c Representative images (b) and time courses (c) of FRET ratios of the ZAP70 saFRET biosensor with Active- (KA, n = 31) or Dead- (KD, n = 19) kinase domain, before and after TAK-659 treatment. Error bars, mean ± SD. Scale bars, 10 µm. See also supplementary video 3. d, The 4D plot of the four enrichment ratios (Ev) of substrate sequences. The enrichment ratios in KAH group (Ev(KAH)) were color-coded, whereas Ev(KAL), Ev(KDH), and Ev(KDL) are plotted along the three-dimensional coordinates. The selected substrate sequences are highlighted with colors represented by the values of their Ev(KAH). e Scatter plot of the substrates. The ZAP70 saFRET biosensors with the top 10 highest products of Ev(KAH) and Ev(KDL) were labeled in red (better biosensors) or blue (worse biosensors). f Time-lapse images of the parental (WT) and improved saFRET biosensors after TAK-659 treatment corresponding to the quantified time courses in (h). Scale bars, 10 µm. See also supplementary video 4. g Percentage changes of saFRET biosensor variants after TAK-659 treatment (From left to right, n = 26,17,17,15,15,31,18,15,20, and 15, respectively, One-way ANOVA, compared to the WT group, ***P < 0.001, *P = 0.0192 and 0.0329, respectively, NS, not significant with a P = 0.138, only the varients with a mean value larger than the WT were subjected to statistical analysis). Error bars, mean ± SD. h Time courses of FRET ratio of the selected saFRET biosensor variant (SREYACI, n = 26), with that of the parental biosensor (WT, n = 44) marked in black. Error bars, Mean ± SEM. b, f The color bar indicates ECFP/FRET ratio, with hot and cold colors representing the high and low ratios, respectively. Source data are provided as a Source Data file.

