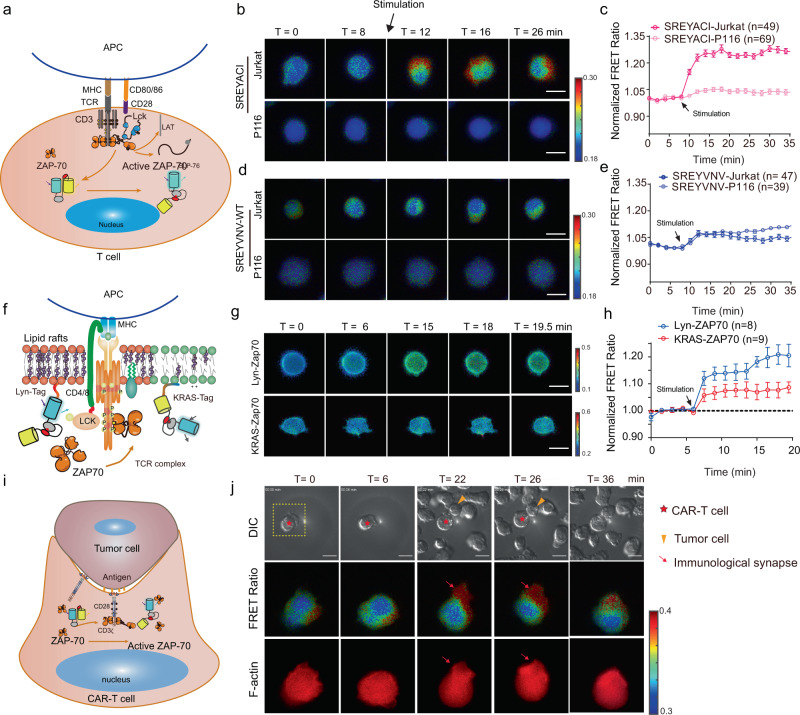
Fig. 4. The sensitivity and specificity of the ZAP70 FRET biosensor in human T cell.
a Working mechanism of the ZAP70 FRET biosensor in reporting TCR signaling. b–e Time-lapse ECFP/FRET ratio (FRET ratio) images (b, d) and time courses (c, e) of improved (b, c) or parental (WT) (d, e) biosensors before and after TCR activation induced by CD3/CD28 antibody stimulation (n is shown in the figure). Error bars, mean ± SEM. Scale bars, 10 µm. See also supplementary video 5. f Schematics of membrane-bound biosensors which target different membrane compartments. Lyn- and Kras-ZAP70 FRET biosensors target the lipid rafts or non-raft regions, respectively. g–h Time-lapse FRET ratio images (g), and the normalized FRET ratio (h) of ZAP70 activities in different membrane compartments after TCR activation before and after CD3/CD28 antibody stimulation. (n is shown in the figure). Error bars, mean ± SEM. Scale bars, 10 µm in (g. i). Schematics of CD19-CAR Jurkat T cell engaging with a CD19+ tumor Toledo cell. j Time-lapse FRET ratio images of CAR-T cell expressing the improved ZAP70 FRET biosensor before and after the engagement with a target tumor Toledo cell. Each biological replicate had similar results (n = 4). Scale bars, 10 µm. See also supplementary video 6. The color bar in (b, d, g, j) indicates FRET ratio (ECFP/FRET), with hot and cold colors representing the high and low ratios, respectively. Source data are provided as a Source Data file.

