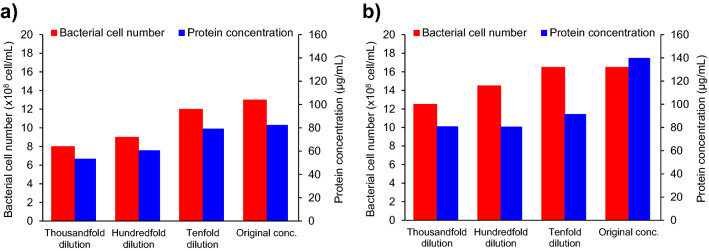
Figure 6.
Bacterial cell number and protein concentration after 84 h cultivation of P. aeruginosa in the nanobubbles media. (a) Bacterial cell number (red bars, set on the left-hand axis) and protein concentration (blue bars, set on the right-hand axis) detected in the oxygen nanobubbles medium after 84 h cultivation. (b) Bacterial cell number (red bars, set on the left-hand axis) and protein concentration (blue bars, set on the right-hand axis) detected in the carbon dioxide nanobubbles medium after 84 h cultivation.

