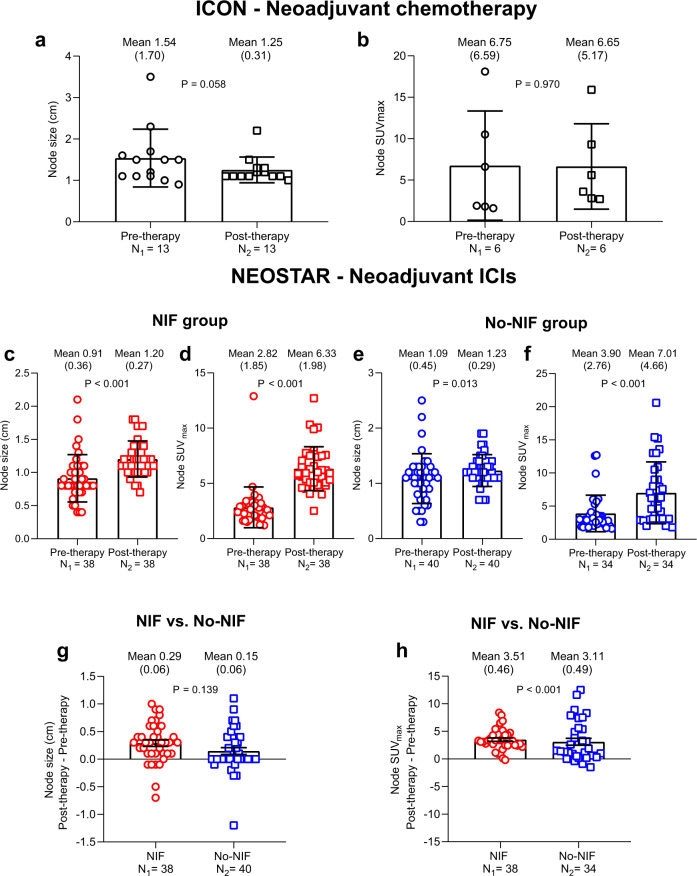
Fig. 3. Changes in node size and SUVmax in ICON and NEOSTAR patients with abnormal nodes post-therapy.
a Mean node size (cm) of abnormal nodes post-neoadjuvant chemotherapy as compared to pre-therapy in ICON patients. Data are shown as mean node size in cm ±SD. Two-sided P value is from linear mixed-effects model. N1 = 13 nodes analyzed in nine patients. N2 = 13 nodes analyzed in nine patients. b Mean node SUVmax of abnormal nodes post-neoadjuvant chemotherapy as compared to pre-therapy in ICON patients. Data are shown as mean node SUVmax ±SD. Two-sided P value is from linear mixed-effects model. N1 = 6 nodes analyzed in three patients. N2 = 6 nodes analyzed in three patients. c, d Mean node size (c) and SUVmax (d) of abnormal nodes post-neoadjuvant ICIs as compared to pre-therapy in NEOSTAR patients with NIF. Data are shown as mean node size in cm ±SD in panel (c) and mean SUVmax ±SD in panel (d). N1 = 38 nodes analyzed in seven patients. N2 = 38 nodes analyzed in seven patients. Two-sided P value is from linear mixed-effects model. The red circles and squares depict the node size and SUVmax collected from pre-therapy and post-therapy, respectively, in the NIF group. e, f Mean node size (e) and SUVmax (f) of abnormal nodes post-neoadjuvant ICIs as compared to pre-therapy in NEOSTAR patients with No-NIF. Data are shown as mean node size in cm ±SD in panel (e) and mean SUVmax ±SD in panel (f). N1 = 40 nodes analyzed in 17 patients (e); 34 nodes analyzed in 15 patients (f) with available scans/images. N2 = 40 nodes analyzed in 17 patients (e); 34 nodes analyzed in 15 patients (f) with available scans/images. Two-sided P value is from linear mixed-effects model. The blue circles and squares depict the node size and SUVmax collected from pre-therapy and post-therapy, respectively, in the No-NIF group. g Difference in mean size of abnormal nodes between post- and pre-therapy in NEOSTAR patients with NIF as compared with those with No-NIF. Data are shown as change in mean node size in cm ±SE. N1 = 38 nodes analyzed in seven patients. N2 = 40 nodes analyzed in 17 patients. Two-sided P value is from linear mixed-effects model. The red circles depict the change of node size in NIF group, and the blue squares depict the change of node size in No-NIF group. h Difference in mean SUVmax of abnormal nodes between post- and pre-therapy in NEOSTAR patients with NIF as compared with those with No-NIF. Data are shown as change in mean node SUVmax ±SE. N1 = 38 nodes analyzed in seven patients. N2 = 34 nodes analyzed in 15 patients. Two-sided P value is from linear mixed-effects model. The red circles depict the change of node SUVmax in NIF group, and the blue squares depict the change of node SUVmax in No-NIF group. ICON, ImmunogenomiC prOfiling in NSCLC; NIF, nodal immune flare; ICIs, immune checkpoint inhibitors; SUV, standardized uptake value; SD, standard deviation; SE, standard error. Source data are provided as a Source Data file.

