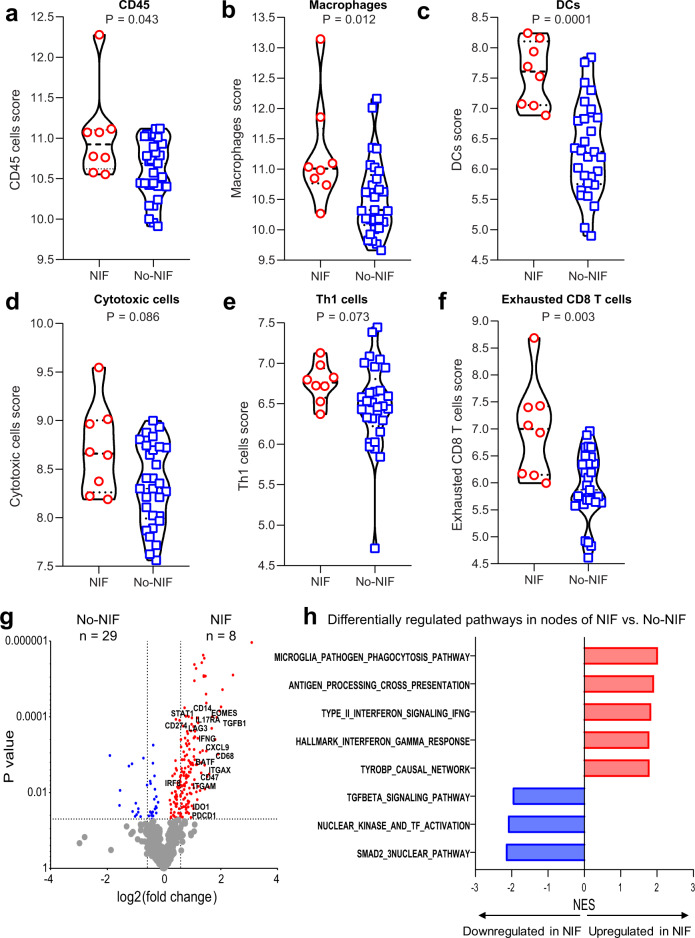
Fig. 4. Composition of nodal immune infiltrates of NIF/non-caseating granulomas and No-NIF NEOSTAR patients.
NanoString gene expression analysis was performed in tumor-free nodes from patients with NIF (n = 8) and No-NIF (n = 29). The NIF group for these analyses includes patients with available nodal samples after neoadjuvant therapy that were cancer-free and contained non-caseating granulomas with available nodal NanoString expression data. a–f Violin plots show the distribution of immune scores (log2 normalized counts) in nodes resected from NIF and No-NIF patients in the NEOSTAR study: immune cells expressing CD45 (a), macrophages (b), dendritic cells (DCs) (c), cytotoxic cells (d), Th1 cells (e), and exhausted CD8 T cells (f). The log2 normalized counts are presented as median with minima, lower and upper quartiles, and maxima. The dashed line indicates the median; the dotted lines indicate the lower quartile and upper quartile values; top and bottom of the violin plots indicate the maxima and minima. The red circles depict data from NIF group, and the blue squares depict data from No-NIF group. g Differential expression of genes between NIF and No-NIF nodal samples are illustrated as a volcano plot. Red dots depict significantly upregulated genes in NIF compared to No-NIF nodes and blue dots represent significantly upregulated genes in nodes of No-NIF compared to nodes of NIF patients. h Bar plots showing differentially expressed pathways between nodes of NIF and No-NIF patients, computed by GSEA analysis. Red bars indicate pathways that are upregulated while blue bars indicate pathways that are downregulated in nodes of NIF compared to nodes of No-NIF patients. Two-sided P value is from Wilcoxon rank-sum test in panels (a–f). Two-sided P values are from Welch’s t-test in panel (g). P values (FDR-adjusted < 0.2) are from GSEA algorithm in panel (h). NIF, nodal immune flare; DCs, dendritic cells; Th1, T helper cells 1. NES, normalized enrichment score. Source data are provided as a Source Data file and Supplementary Data file (Supplementary Data 1).

