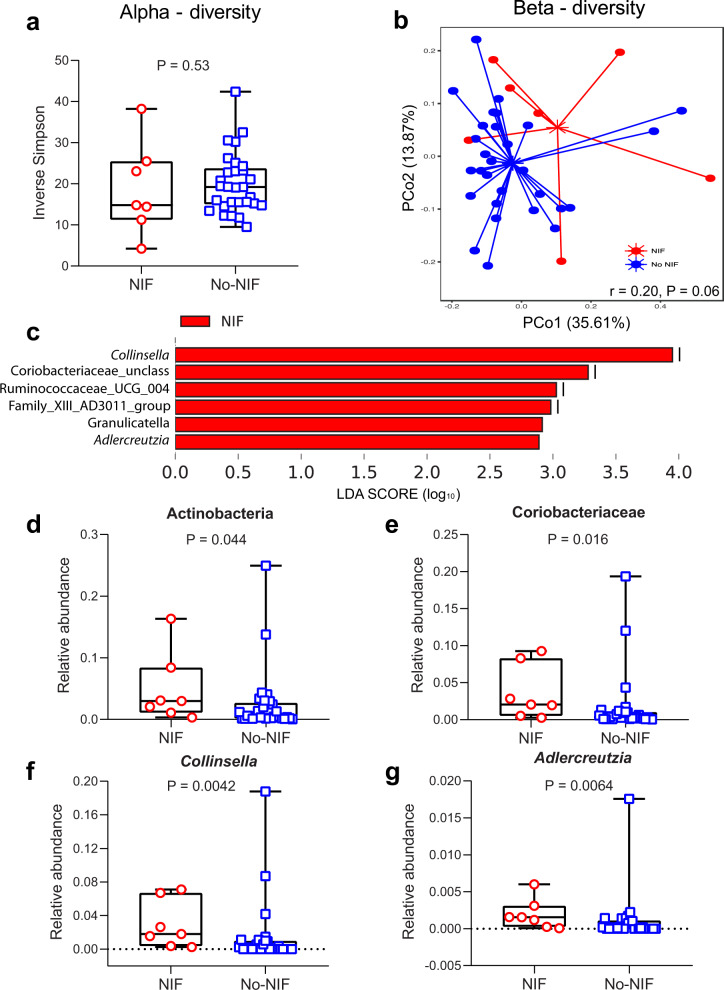
Fig. 5. Analysis of gut microbiome diversity and composition conducted by sequencing V4 region of 16 S rRNA gene in NIF and No-NIF NEOSTAR patients.
a Inverse Simpson measuring alpha diversity of fecal microbiome in NIF (n = 7) and No-NIF (n = 29) patients. Data are presented as median with minima, lower and upper quartiles, and maxima. The ends of the box are the upper and lower quartiles (75th and 25th percentiles), the median is the horizontal line inside the box. The whiskers are the two lines outside the box that extend to the maxima and minima. Two-sided P value is from Mann-Whitney U test. The red circles depict data from the NIF group, and the blue squares depict data from the No-NIF group. b Ordination plot based on the principal coordinate analysis (PCoA) using weighted UniFrac demonstrating taxonomic similarities between NIF and No-NIF patients. The two axes of the ordination plot explained 49.48% variation in the dataset. Analysis of similarity (ANOSIM) test was used to test whether there is a significant difference between these two groups with 1000 permutations (r = 0.20; P = 0.06). c Linear discriminant analysis (LDA) scores (log10) calculated for differentially abundant bacterial taxa at the genus level in the fecal microbiomes of NIF and No-NIF patients using LDA cutoff of 2 and two-sided P value cutoff of 0.05. d–g Few most differentially abundant bacterial taxa present in fecal samples of NIF (n = 7) and No-NIF (n = 29) patients. Relative abundance comparisons of (d) Actinobacteria (phylum), (e) Coriobacteriaceae (family), (f) Collinsella (genus), and (g) Adlercreutzia (genus) between NIF and No-NIF patients. Data are presented as median with minima, lower and upper quartiles, and maxima. The ends of the box are the upper and lower quartiles (75th and 25th percentiles), the median is the horizontal line inside the box. The whiskers are the two lines outside the box that extend to the maxima and minima. Two-sided P value is from Mann-Whitney U test. The red circles depict data from the NIF group, and the blue squares depict data from the No-NIF group. Source data are provided as a Source Data file.

