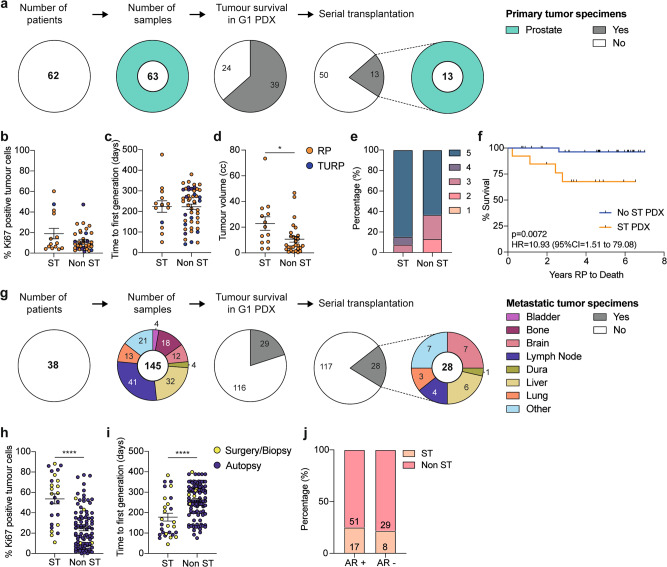
Fig. 2. Pathological and clinical features of tumors used to establish PDXs.
a Pie charts show the number of patients consented and the number of primary prostate tumor samples collected for xenografting compared to the number of samples that maintained tumor tissue in the first generation (G1) PDX and established as serially transplantable (ST) PDXs. Color denotes the site that each sample was taken from. b–d The percentage of Ki67-positive tumor cells in pre-grafted tissue (b; n = 14 ST, 38 non ST), time to first generation (c; n = 14 ST, 49 non ST), and tumor volume at surgery for radical prostatectomy (RP; orange) and transurethral resection of the prostate (TURP; purple) specimens (d; n = 13 ST, 28 non ST, P = 0.016) that established ST PDXs compared to those that did not. Unpaired two-sided T test for ST vs non ST; data shown as mean ± SEM. e The percent of primary tumors with a Gleason grade group of 1–5 that did (n = 13) or did not establish ST PDXs (n = 30; not significant, Mann Whitney test comparing the distribution of Gleason grade groups between ST vs non ST). f Kaplan–Meier curve comparing the survival of patients whose RP specimen did (orange; n = 13) or did not (blue; n = 37) establish ST PDXs. P = 0.0072; log rank test; HR = 10.93; 95% CI 1.51 to 79.08. g Pie charts show the number of patients consented and the number of metastatic tumor samples collected for xenografting compared to the number of samples that maintained tumor tissue in the G1 PDX and established as serially transplantable PDXs. Color denotes the site that each sample was taken from. h–i The percentage of Ki67-positive tumor cells in pre-grafted tissue (h; n = 25 ST, 94 non ST, P < 0.0001), and time to first generation (i; n = 28 ST, 117 non ST, P < 0.0001) for metastatic tumor samples obtained from surgery/biopsy (yellow) or autopsy (purple) that did or did not establish ST PDXs. Unpaired two-sided T test for ST vs non ST; data shown as mean ± SEM. j The percentage of androgen receptor (AR)-positive and AR-negative metastatic tumors that did (n = 25) or did not establish ST PDXs (n = 80), based on immunohistochemistry for AR in the original tumor tissue. Not significant; Fisher’s exact test. Source data are provided as a Source Data file.

