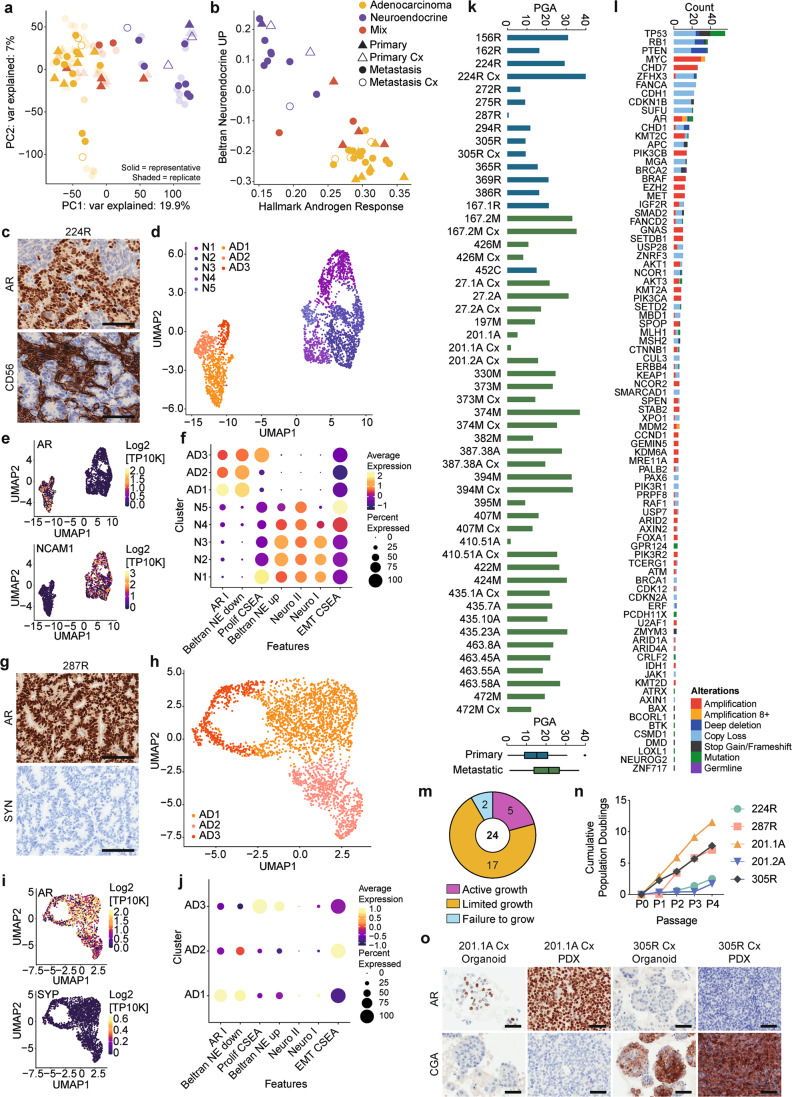
Fig. 3. Phenotypic and genomic heterogeneity within and between PDXs.
a, b Principle component (PC) analysis of gene expression from RNA sequencing in PDXs grown in testosterone-supplemented (+T; filled symbol) or castrate (Cx; empty symbol) mice. PDXs from metastases are represented by circles, and primary tumors by triangles. PDX pathology is indicated (adenocarcinoma—yellow; neuroendocrine—purple; mixed— red). Representative samples from each PDX are colored symbols (PDXs from primary prostate cancer—triangles, PDXs from metastatic prostate cancer—circles), while replicates are shown as transparent symbols. a PCA plot based on PC1 and PC2, showing the two largest sources of variation in the expression of genes across PDXs. b Plot of gene set enrichment analysis using Singscore to compare Beltran Neuroendocrine Score to Hallmark Androgen Response Score in PDXs. c–j Single-cell RNA sequencing reveals intra-tumoral heterogeneity of adenocarcinoma (AD) and neuroendocrine (NE) PDXs. c Representative immunohistochemical staining of PDX 224R for androgen receptor (AR) and NE marker NCAM1 (CD56; scale bars = 100 µM). d–e UMAP (d) and marker gene expression (e) of PDX 224R showing the presence of 3 AD and 5 NE clusters based on single-cell RNA sequencing. f Dot plot comparing expression of AR79, NE gene signatures (Beltran NE80, Neuro I, Neuro II79), and hallmark signatures (proliferation and epithelial-mesenchymal transition: EMT81) across the AD and NE clusters for PDX 224R. g Representative immunohistochemical staining of PDX 287R for AR and synaptophysin (SYN; scale bars = 100 µM). h–i UMAP (h) and marker gene expression (i) of PDX 287R showing the presence of 3 AD clusters. j Dot plot comparing expression of AR79, NE gene signatures (Beltran NE80, NeuroI, NeuroII79), and hallmark signatures (proliferation and epithelial-mesenchymal transition: EMT81 across the AD clusters for PDX 287R. k–l Somatic mutation frequency and genomic-landscape analyses based on targeted DNA sequencing. k The percent genome alteration (PGA) in PDXs from testosterone-supplemented and castrated (Cx) host mice from primary (blue) and metastatic (green) samples. l The number of somatic alterations per gene across the PDX cohort. Somatic nucleotide variations with 0.75 or greater allelic frequency are reported (amplification—red; amplification with 8 or more copies—orange; deep deletion—dark blue; copy number loss—light blue (i.e. fewer copies than baseline ploidy); stop gains and frameshift mutations—black; missense mutation—green; germline mutation—purple). m–o Phenotypic heterogeneity is maintained in organoids established from PDXs. m Pie chart showing the growth of 24 PDXs as organoids (active: increased population doublings ≥4 passages (purple); limited: growth/survival for ≤3 passages (orange); failure: poor growth (blue)). n Cumulative population doublings population doublings of organoids organoids across passages. Source data are provided as a Source Data file. o Representative immunohistochemical staining for AR and chromogranin A (CgA) in PDX tissue and organoids from PDX 201.1A-Cx and PDX 305R-Cx (scale bars = 50 µM). For panels with NE markers, the highest expressed marker is shown. Staining is repeated every fifth generation across all PDXs, and for representative organoid cultures.

