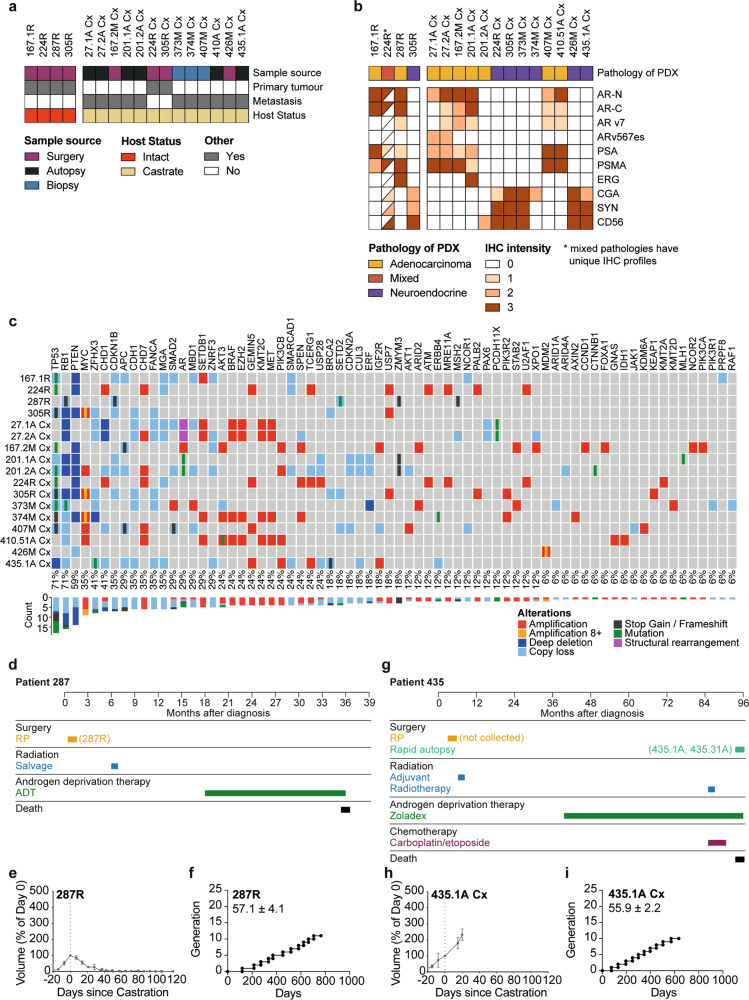
Fig. 4. Applying serially transplantable PDXs as ‘research-ready’ models for preclinical testing.
a Heatmap shows sample source (surgery—purple; autopsy—black; biopsy—blue), tumor type (indicated as yes (gray) or no (white)), host mouse status (intact—red; castrate— yellow) of 17 PDXs that have been classified as ‘research-ready’ for preclinical testing based on rapid turnover and subcutaneous growth in host mice. b Heatmap shows pathology (adenocarcinoma—yellow; neuroendocrine—purple; mixed—red) and immunohistochemistry (IHC) analysis of the research-ready PDXs (staining intensity indicated as 0, 1, 2, 3 and depicted as a gradient of brown coloring). Half-filled squares indicate mixed IHC staining in PDX 224R due to mixed adenocarcinoma and neuroendocrine pathology. c Summary of key somatic alterations in research-ready PDXs based on targeted DNA sequencing. The percent of PDXs with alterations in individual genes are shown. The bar plot shows the number of alterations observed in individual genes across the PDX cohort. Somatic nucleotide variations with 0.75 or greater allelic frequency are reported (amplification with three or more copies—red; amplification with eight or more copies—yellow; deep deletion—dark blue; copy loss—light blue; stop gains and frameshift mutations—black; missense mutation—green; structural rearrangements—pink). d Treatment timeline from diagnosis to death for patient 287. e Tumor volume, presented as a percent change in tumor volume from castration (day 0; n = 6 grafts) and f growth trajectory of PDX 287R. The average time per generation is 57.1 ± 4.1 days for PDX 287R in testosterone-supplemented host mice. g Treatment timeline from diagnosis to death for patient 435. h Tumor volume, presented as a percent change in tumor volume from castration (day 0; n = 3 grafts) and i growth trajectory of PDX 435.1A-Cx. The average time per generation is 55.9 ± 2.2 days for PDX 435.1A-Cx in castrate host mice. e, h Grafts were established subcutaneously in testosterone-supplemented mice until tumor volume reached 200 mm3, at which point host mice were castrated (n = 2–4 grafts; data shown as mean ± SEM). f, i Each data point represents a different generation with a ≥10-fold increase in tumor volume.

