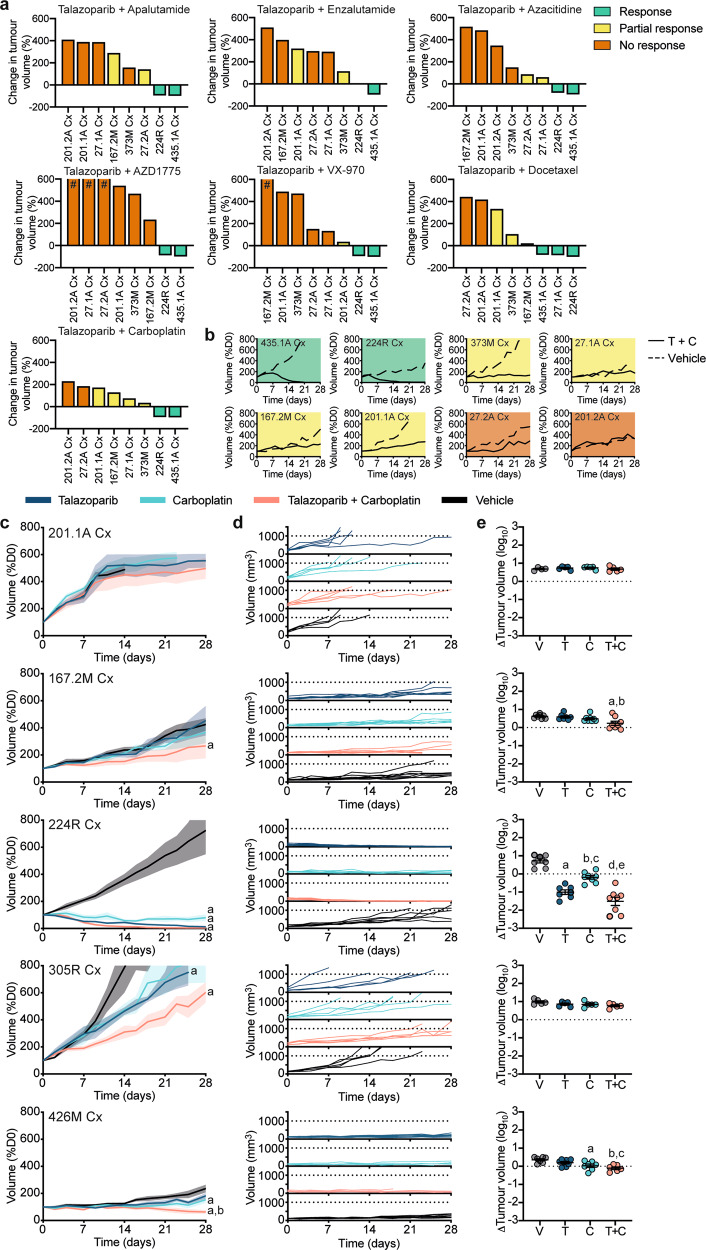
Fig. 5. Preclinical testing of combination therapies in serially transplantable PDXs.
a Waterfall plots of the response of eight research-ready PDXs to talazoparib combination therapies using the one animal per model per treatment (1 × 1 × 1) approach after up to 28 days of treatment. Data presented as the percent change in tumor volume compared to day 0 of treatment (%D0), with a good response shown in green (tumor volume regressed to <100% of starting volume), a partial response shown in yellow (tumor volume between 100–300% of starting volume and ≤50% volume of matched vehicle) and no response shown in orange (tumor volume >300% of starting volume), # tumor volume increases over 600% are not represented. (b) Graphs show tumor volume (%D0) for PDXs treated with vehicle (dotted line) or talazoparib (T) and carboplatin (C) combination therapy (solid line) for up to 28 days using the 1 × 1 × 1 approach (response—green; partial response—yellow; no response— orange). c–e Expansion of talazoparib and carboplatin combination therapy in five PDXs. Mice were treated for up to 28 days with vehicle (V; black; n = 6–8 grafts), 0.33 mg/kg talazoparib (T; dark blue; n = 6–8 grafts), 50 mg/kg carboplatin (C; light blue; n = 6–8 grafts) or talazoparib and carboplatin (T + C; pink; n = 6–8 grafts). Graphs show (c) tumor volume (%D0) for treatment groups (mean ± SEM; aP < 0.05 compared to vehicle, bP < 0.05 compared to talazoparib; linear mixed model analysis with a test of simple main effects, exact P values listed in Supplementary Data 8), d tumor volume (mm3) for individual animals; and, e fold change in tumor volume from day 0 to end of treatment (mean ± SEM; PDX 167.2M Cx—aP = 0.0063 compared to vehicle, bP = 0.0181 compared to talazoparib; PDX 224R-Cx—a,dP < 0.0001 compared to vehicle, bP = 0.0012 compared to vehicle, cP = 0.0047 compared to talazoparib and eP < 0.0001 compared to carboplatin; PDX 426M-Cx—aP = 0.0196 compared to vehicle, bP = 0.0013 compared to vehicle and cP = 0.0358 compared to talazoparib; one-way ANOVA with post hoc Tukey’s test). Source data are provided as a Source Data file.

