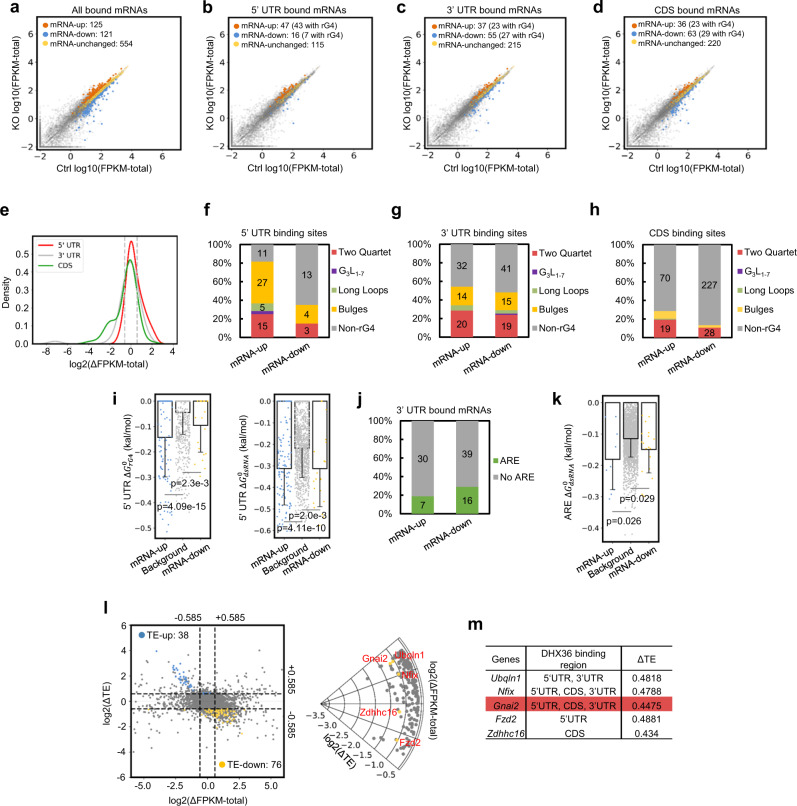
Fig. 6. Dhx36 loss exerts a potential effect on total mRNA abundance.
a–d Scatterplot showing the total mRNA abundance (log10(FPKM-total)) values of all, 5’ UTR, 3’ UTR or CDS DHX36-bound mRNAs in Ctrl vs KO; the number of up- (KO vs Ctrl ≥1.5 fold), down-(≤0.66 fold) or unchanged mRNAs are shown. e Kernel density estimates showing log2(∆FPKM-total) values of mRNAs with DHX36 binding only in 5’ UTRs, 3’ UTRs, or CDS. ∆FPKM-total: the mRNA level alteration in KO vs Ctrl. f–h Prediction of rG4 formation in the binding sites of 5’ UTR, 3’ UTR, and CDS-bound mRNAs was conducted and the number of sites possessing each subtype is shown in up- or downregulated mRNAs. i 5’ UTR region predicted folding energies of rG4 and dsRNA structures in up and downregulated mRNAs with 5’ UTR binding, n = 116 (upregulated mRNAs), 1075 (background mRNAs), 22 (downregulated mRNAs). Data represent mean values ± s.d. j The number of 3’ UTR-bound mRNAs possessing ARE sites is shown. k Predicted folding energies of dsRNAs in up- or downregulated mRNAs with 3’ UTR ARE binding, n = 9 (upregulated mRNAs), 2499 (background mRNAs), 18 (downregulated mRNAs). Data represent mean values ± s.d. l Left: Scatterplot illustrating TE (y axis) and mRNA (x axis) alterations in KO vs Ctrl with a threshold of ±0.585 (dashed line) for 7300 genes with FPKM-total values larger than 1 in either Ctrl or KO condition. Blue dots: TE-up genes with DHX36 binding; yellow dots: TE-down genes with DHX36 binding. Gray dots: the genes with no significant TE change or no DHX36 binding. Right: A total of five bound genes (yellow dots) including Ubq1n1, Nfix, Gnai2, Fzd2, and Zdhhc16 (red font) showed constant mRNA and decreased TE levels in KO vs Ctrl using a more stringent threshold (log2(ΔTE) <−1, ΔTE<0.5). Gray dots: 197 genes with significant TE decrease and constant mRNA levels but with no DHX36 binding. m DHX36 binding regions and ΔTE values are shown for the five genes in panel l and Gnai2 is highlighted. One-tailed Mann–Whitney test was used to calculate the statistical significance between folding energy values in panels i and k with P values shown in the figure.

