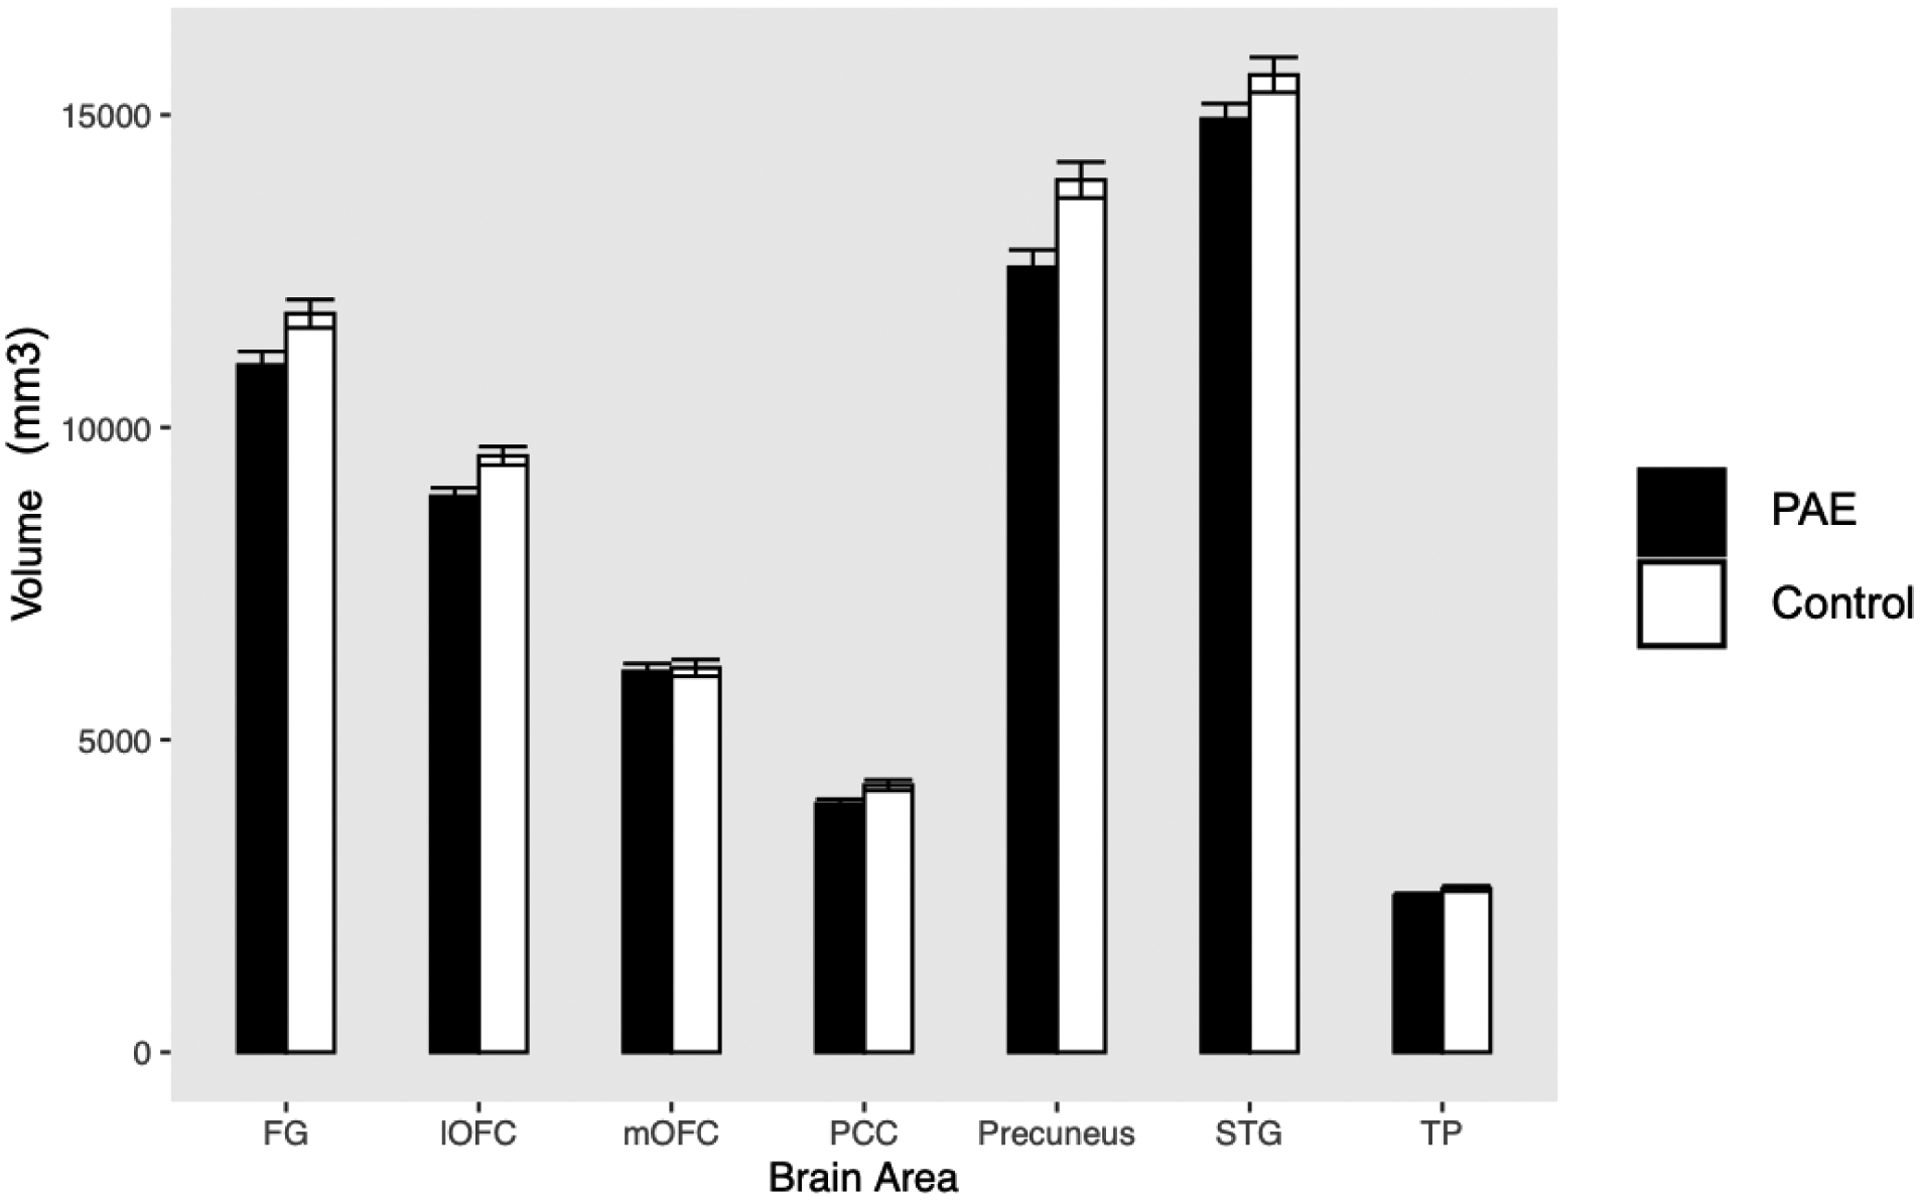
Figure 2.

Differences in gray matter volumes between children and adolescents with prenatal alcohol exposure (PAE; n = 40) and control participants without PAE (n = 39)
Note. Error bars represent standard errors of the mean.
FG = fusiform gyrus; lOFC = lateral orbitofrontal cortex; mOFC = medial orbitofrontal cortex; PCC = posterior cingulate cortex; STG = superior temporal gyrus; TP = temporal pole
