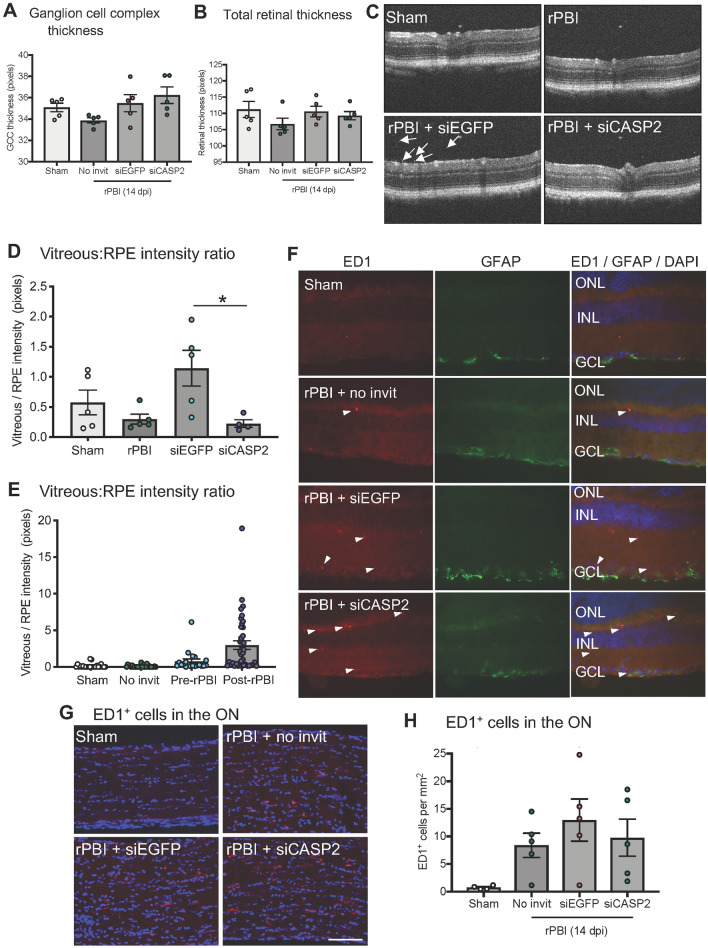
Figure 5.
b-ITON and “pre-blast” injections had no effect on retinal thickness, but there were differential effects on vitreal inflammation. (A) There were no significant differences in GCC between any groups (P = 0.1016, ANOVA). (B) There were also no differences in total retinal thickness across any groups (P = 0.7667, ANOVA). (C) Representative OCT retinal scans used to quantify vitreal haze (arrows show examples of vitreous haze). (D) Vitreous intensity normalized to RPE intensity increased after b-ITON and siEGFP compared to b-ITON alone (P = 0.002), but did not increase with siCASP2 injections and remained similar levels to b-ITON alone (P > 0.05). There was a significant decrease in vitreous intensity between siEGFP and siCASP2 injected eyes (P = 0.033, post-hoc Tukey). (E) Vitreous intensity normalised to RPE intensity was also compared between grouped siCASP2 and siEGFP injections administered “pre-blast” and “post-blast”. There was greater vitreal intensity after b-ITON with “post-blast” intravitreal injections at 28 dpi compared to b-ITON with “pre-blast” intravitreal injections at 14 dpi (P = 0.001, GEE). (F) Representative retinal IHC images stained with DAPI (blue), ED1 (red) and GFAP (green) showing retinal ED1+ cell infiltration after b-ITON and greater after b-ITON with siCASP2 and siEGFP intravitreal injections. (G) Representative ON IHC images for DAPI (blue) and ED1 (red). (H) There was weak evidence for an increase in ED1+ cells in the ON in b-ITON groups (P = 0.075, ANOVA). Scale bars in (F,G) = 100 μm. Error bars represent mean ± SEM.

