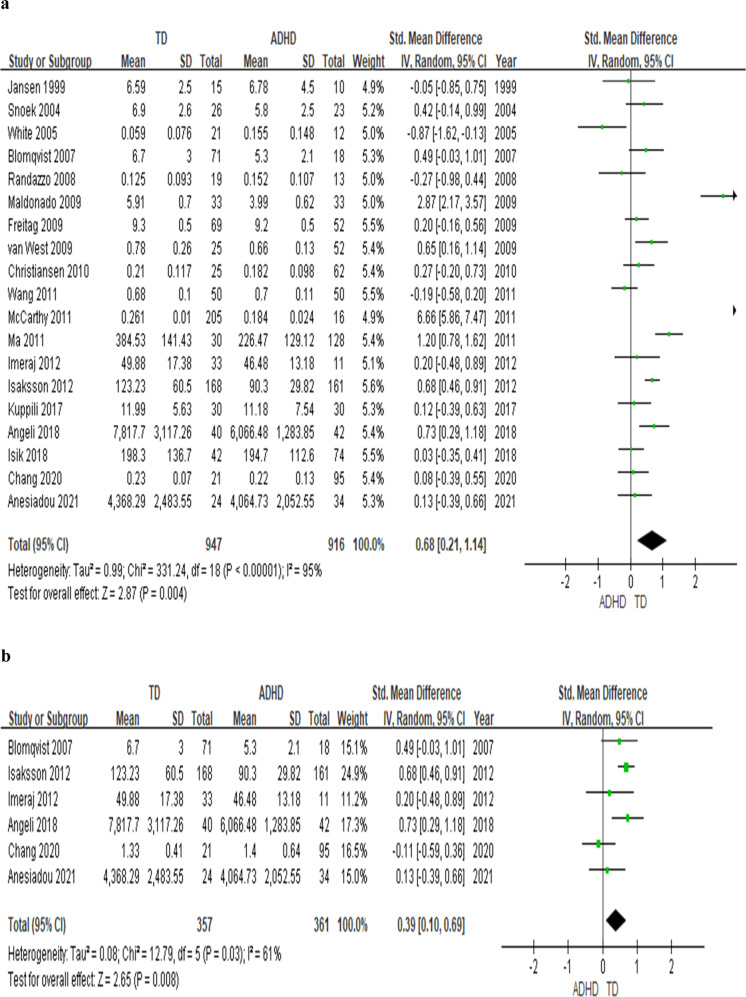
Fig. 1. Forest plots comparing effect sizes of basal cortisol levels and AUCg between ADHD and TD groups.
Forest plots showing effect sizes (Hedges’s g) and 95% confidence intervals (CIs) from individual studies and pooled results comparing (a) cortisol levels at any time point throughout the day and (b) cortisol AUCg between ADHD population and TD group. Note, ADHD attention deficit hyperactivity disorder, AUCg area-under-the-curve with respect to the ground, CI confidence interval, Std standard, TD typically developing youth.

