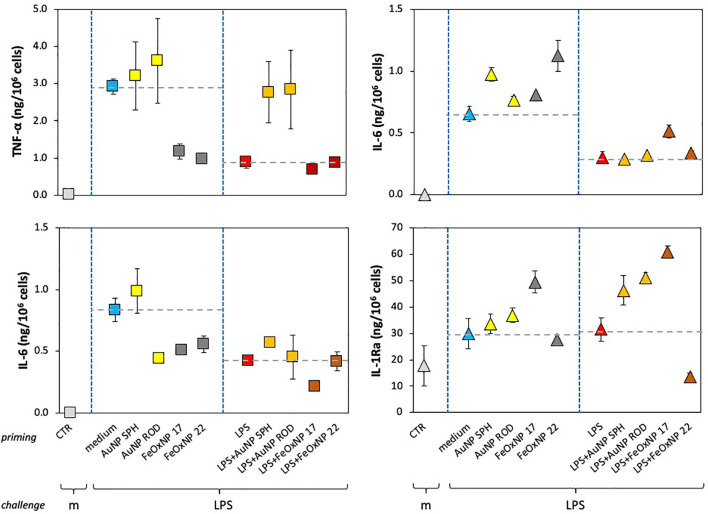
Figure 4.
Innate memory response of human monocytes from individual donors, primed with AuNP or FeOxNP alone or together with LPS. Human monocytes isolated from blood of two individual donors (donor 3, square symbols, left panels; donor 2, triangle symbols, right panels) were cultured for 24 h in culture medium alone or containing serum-precoated NP: 5.7 µg/ml AuNP SPH, 1.4 µg/ml AuNP ROD, 2 µg/ml FeOxNP 17 and 2.7 µg/ml FeOxNP 22, alone or together with 1 ng/ml LPS (line priming in abscissa). Cells were then washed and rested for 6 days in the absence of stimuli, then challenged for 24 h in fresh medium alone or containing 5 ng/mL LPS (m and LPS in the abscissa line challenge). The production of TNFα (upper left), IL-6 (upper right and lower left), and IL-1Ra (lower right) was measured in the 24 h supernatants by ELISA. Data are reported as mean ± SD of replicate determination from individual donors out of four tested (all shown in Figure 3). Horizontal dotted lines represent the reference values of cells primed with medium alone and cells primed with LPS in the two parts of each panel. The basal response of control cells (CTR), i.e., primed or unprimed cells rested for 6 days and then exposed for 24 h to medium alone, is shown at the extreme left in each panel (grey symbols). Statistical significance is as follows. Upper left panel: CTR vs. medium, p <0.0001; medium vs. LPS, p <0.005; medium vs. FeOxNP, p <0.005; LPS vs. LPS + AuNP, p <0.05. Upper right: CTR vs. medium, p <0.0001; medium vs. LPS, p <0.005; medium vs. AuNP SPH and FeOxNP 22, p <0.05; LPS vs. LPS + FeOxNP 17, p <0.05. Lower left: CTR vs. medium, p <0.0001; medium vs. LPS, p <0.01; medium vs. AuNP ROD, FeOxNP 17 and FeOxNP 22, p <0.05; LPS vs. LPS + FeOxNP 17, p <0.05. Lower right: medium vs. FeOxNP 17, p <0.05; LPS vs. LPS + all NP, p <0.05. All other relevant comparisons are not significant.

