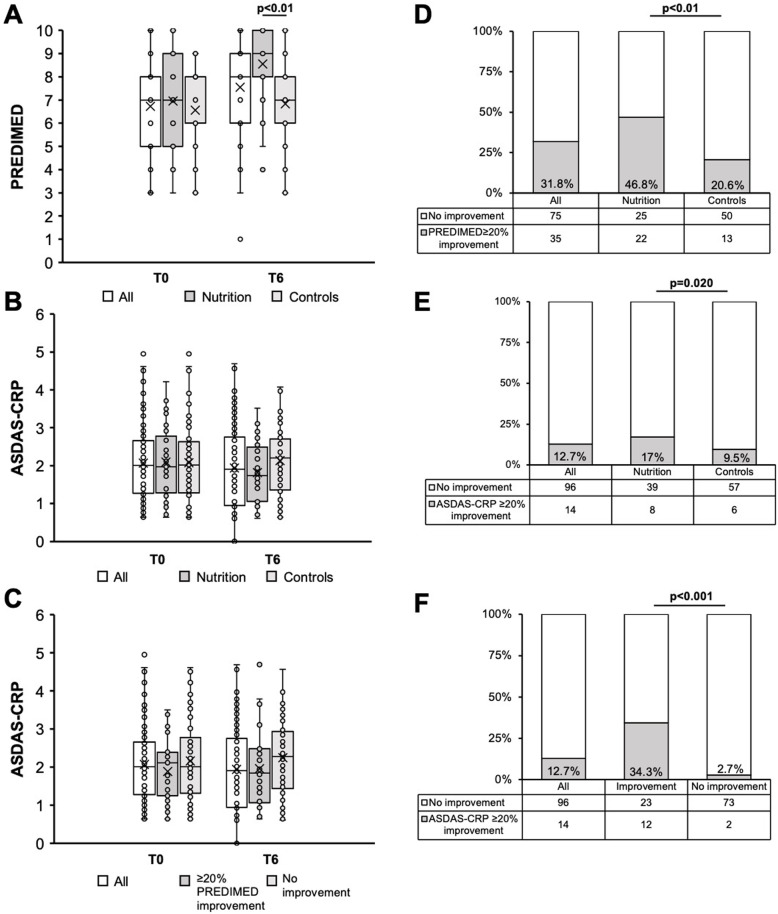
Fig. 1.
A PREDIMED score at T0 and T6 in all subjects, in the nutritional group, and in controls. B ASDAS-CRP at T0 and T6 in all subjects, in the nutritional group, and in controls. C ASDAS-CRP at T0 and T6 in all subjects, in subjects achieving a ≥ 20% PREDIMED improvement at T6 vs. T0, and in those who did not. D Frequency of ≥20% PREDIMED improvement at T6 vs T0 in all subjects, in the nutritional group, and in controls. Frequency of ≥20% ASDAS-CRP improvement in all subjects, in the nutritional group, and in controls. F Frequency of ≥20% ASDAS-CRP improvement at T6 vs T0 in all subjects, in subjects achieving a ≥ 20% PREDIMED improvement at T6 vs T0, and in those who did not. In box plots (A–C), mean values are represented as X

