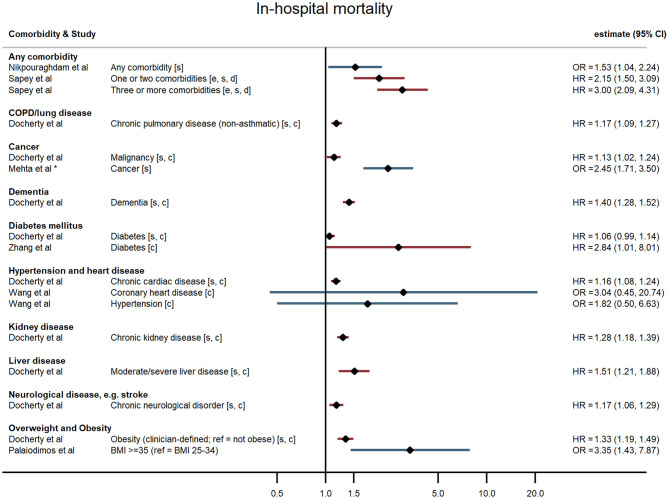
Figure 2.
Forest plot of study estimates of the association between comorbidities and COVID-19 mortality among hospitalized patients. Reference category for each comorbidity is the absence of that comorbidity, except where stated otherwise. HR, hazard ratio (red); OR, odds ratio (blue); CI, confidence interval; BMI, body mass index; COPD, chronic obstructive pulmonary disease. All estimates adjusted for age. Additionally adjusted for: sex [s]; other comorbidities [c]; ethnicity [e]; deprivation [d]. *95% CI not reported, but back-calculated from reported p-value.

