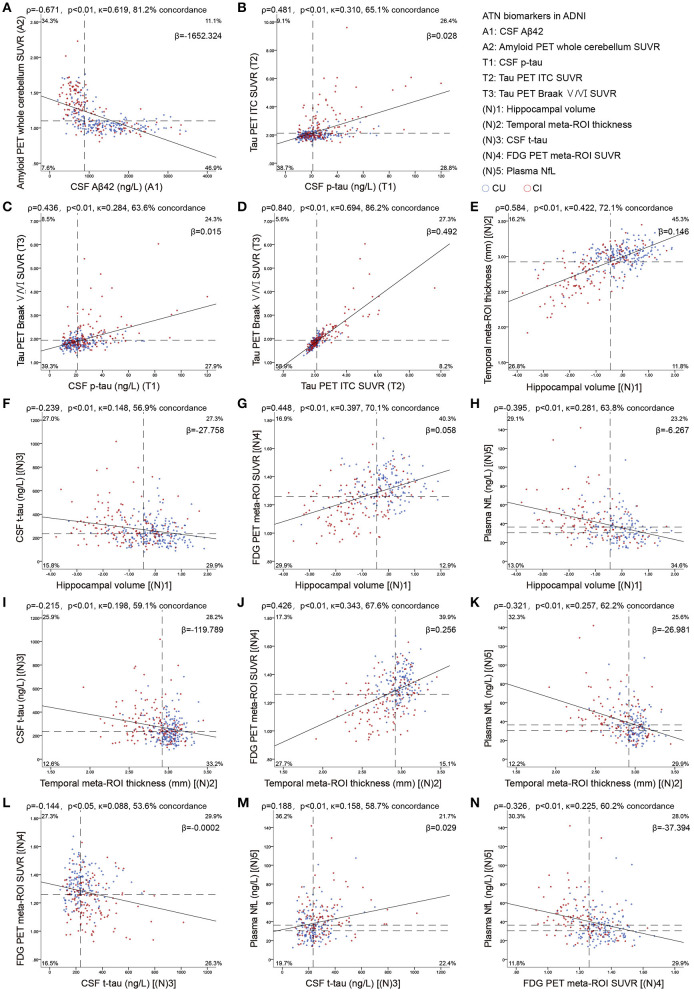
Figure 1.
Scatterplots show the association between continuous measures for amyloid (A), tau (B–D), and neurodegeneration (E–N) biomarkers. Dashed lines indicate cutoff points. Spearman's correlations (ρ) with p-values, Cohen's kappa statistic (κ), concordance (percentage showing both biomarkers positive or negative), and the slope (β) of regression curve are shown at the top of each panel. For A comparisons, the upper left and the lower right quadrants indicate concordance positive (+/+) and negative (–/–). For T comparisons, lower left and upper right quadrants indicate concordance positive and negative, respectively. For the comparisons of (N)3 with (N)5, the upper right and lower left quadrants indicate concordance positive and negative, respectively. For the four remaining (N) comparisons, concordant positives are shown in the upper left quadrant, whereas concordant negatives are shown in the lower right quadrant. Percentage figures across quadrants indicate distribution (percentagewise) of participants. Aβ, β-amyloid; AT(N), β-amyloid, tau, and neurodegeneration classification system; CI, cognitively impaired; CU, cognitively unimpaired; ITC, inferior temporal cortex; NfL, neurofilament light; p-tau, tau phosphorylated at Thr181; ROI, region of interest; SUVR, standardized uptake value ratio; t-tau, total tau.

