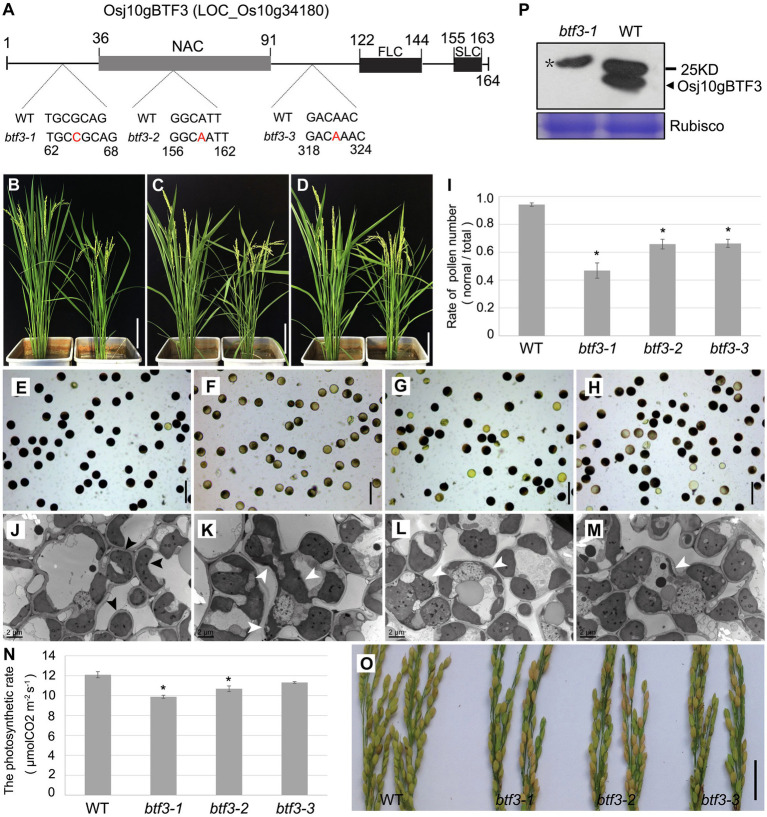
Figure 1.
Loss of Osj10gBTF3 affects pollen and chloroplast development in rice. (A) Schematic of domain structure of Osj10gBTF3 and mutation sites of btf3 mutants. FLC and SLC indicate the first and second complexity domains, respectively. (B–D) Comparison of plant height between WT plants (left) and the btf3-1 (B), btf3-2 (C), and btf3-3 (D) mutants (right). (E–H) KI-I2 staining of pollen grains of WT (E) and btf3-1 (F), btf3-2 (G), and btf3-3 (H) mutants. (I) The proportion of normal pollens checked by KI-I2-staining in WT and btf3-1, btf3-2, and btf3-3 mutants. *indicates p < 0.05. (J) to (M) Comparison of chloroplast in the leaves between WT and btf3-1, btf3-2, and btf3-3 mutants (TEM). Black and white arrows indicate the normal and abnormal chloroplasts, respectively. (N) Comparison of photosynthetic rate between WT and btf3-1, btf3-2, and btf3-3 mutants. Fifteen plants were selected for each material to measure the photosynthetic rate. *indicates p < 0.05. (O) Comparison of panicles between WT (left) and btf3-1, btf3-2, and btf3-3 mutants (right) at the maturing stage. Compared with WT, the number of grains with normal seeds-setting (yellow) were much fewer in btf3-1, btf3-2, and btf3-3 mutants. (P) Western blot analysis of Osj10gBTF3 protein level in WT and the btf3-1 mutant. Star(*) indicates the non-specific band. Scale bars: 20 cm in (B–D), 100 μm in (E–H), and 5 cm in (O).

