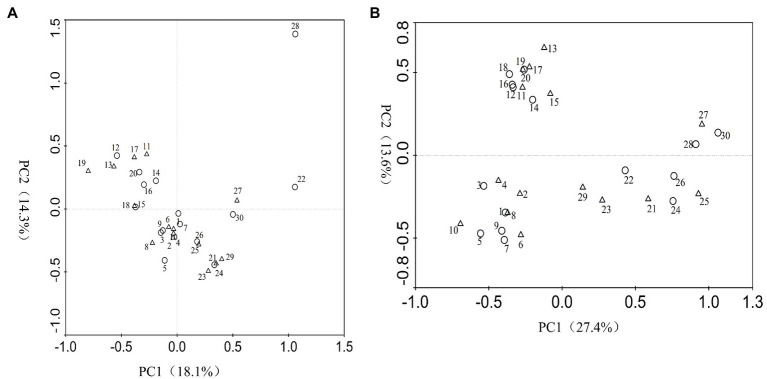
Figure 5.
Principal components analysis (PCA) of fungi (A) and bacteria (B) species generated from DGGE band patterns. Circle represents pine seedlings non-inoculated with PWN, and triangle represents pine seedlings inoculated with PWN. 1~10, 11~20, and 21~30 represent samples from P. tabulaeformis seedlings inoculation of A. vaginata, S. bovines, G. cylindrosporus, P. chrysanthemicola, and control treatments at 3, 6, and 9 months after PWN infection, respectively. PC1, principal component 1; PC2, principal component 2.

