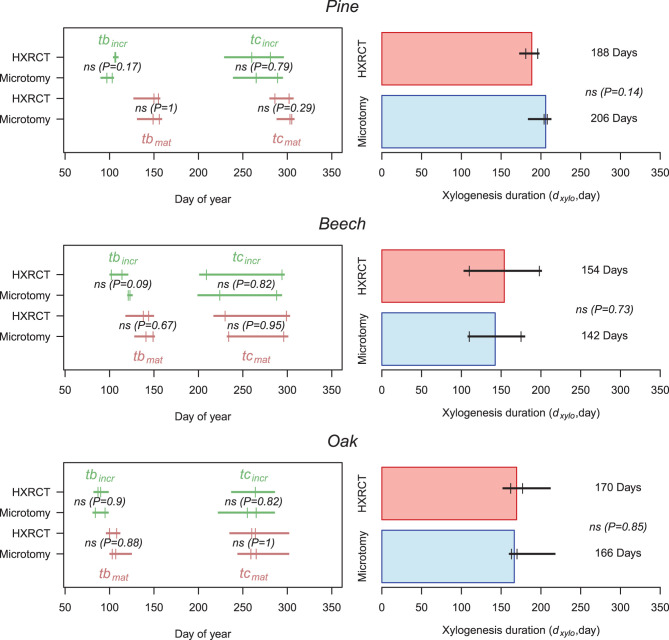
Figure 7.
Xylogenesis calendar and duration. Left panels: Estimates of size growth beginning (tbincr) (i.e., beginning of xylogenesis) and size growth ending (teincr) (green) as well as mature xylem production beginning (tbmat) and ending (temat) (i.e., ending of xylogenesis) (brown) are presented for HXRCT and microtomy. Green and brown lines range from minimum to maximum estimated dates, while second and third quartile are represented by short vertical lines. Right panels: Estimates of xylogenesis duration (dxylo) (median) for HXRCT (red) and microtomy (blue) are presented. Black lines range from minimum to maximum estimated duration, while second and third quartile are represented by short vertical lines. The significance of the bootstrap resampling test (P) assessing the difference between HXRCT and microtomy is reported.

