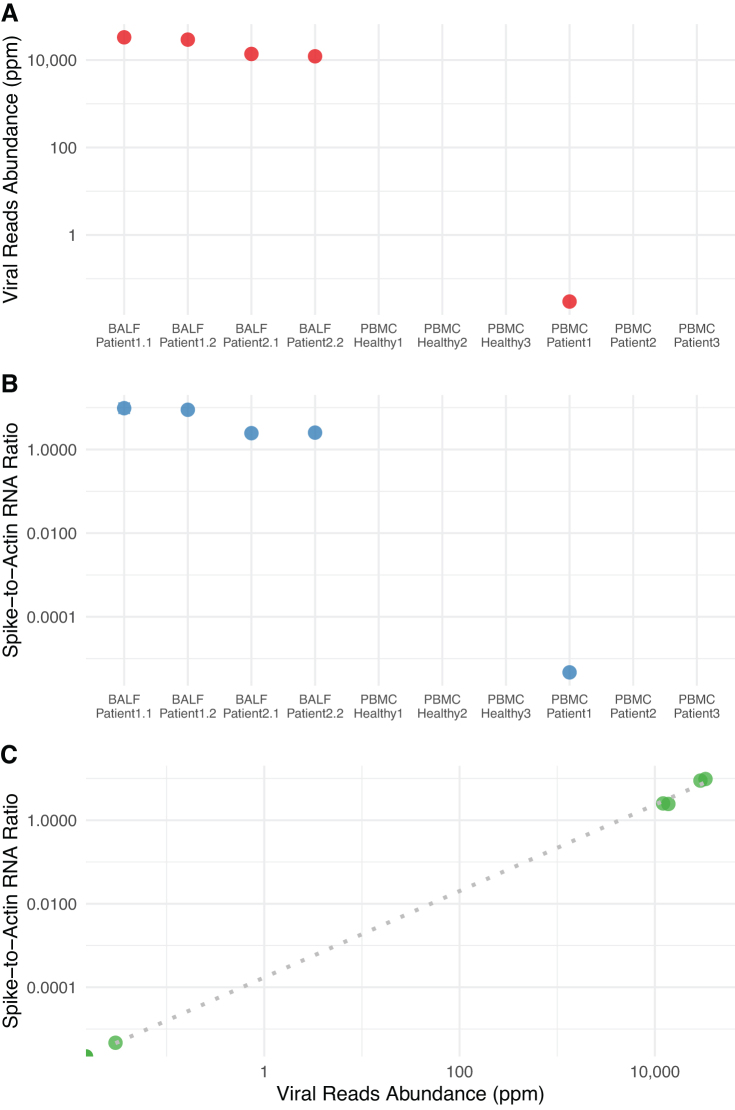
FIG. 4.
Abundance of SARS-CoV-2 sequence reads relative to the host gene expression. (A) Normalized abundance of SARS-CoV-2 sequence reads, estimated as the number of SARS-CoV-2-specific hits per million sequence reads. (B) SARS-CoV-2 spike-to-human actin ratio for each sample. (C) A scatter plot showing the correlation between SARS-CoV-2 spike-to-human actin ratio and SARS-CoV-2 sequence reads abundance (in ppm). ppm, parts per million; SARS-CoV-2, severe acute respiratory syndrome coronavirus 2.

