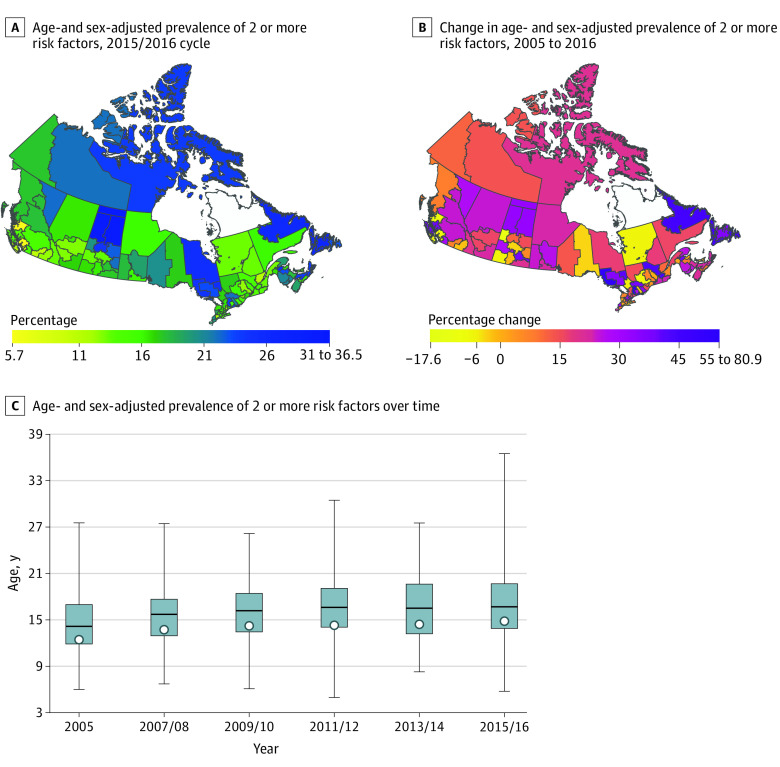
Figure 1. Health Region–Level Age- and Sex-Adjusted Prevalence of 2 or More Cardiovascular Risk Factors.
A and B, 2 health regions (ie, Région du Nunavik and Région des Terres Cries de la Baie James) are blank because of missing data. C, The bottom border, middle line, and top border of the boxes indicate the 25th, 50th, and 75th percentiles, respectively, across all health regions; the whiskers indicate the full range across all health regions; and the circles indicate the national-level prevalence rate.

