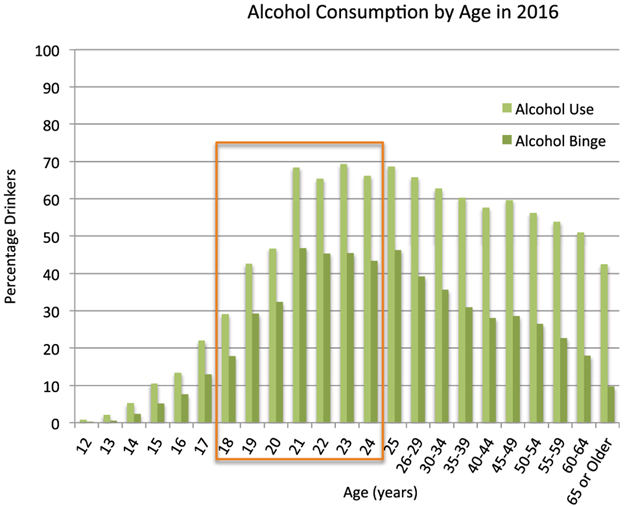
Figure 1.
Alcohol consumption by age in 2016. Bars represent percent-age of people drinking at age bands from 12 to 65 years of age and older. The light green bars denote all alcohol drinkers, and the dark green denote alcohol binge drinkers. The orange box encompasses the ages studied at baseline by Meda et al. (1). Data from Substance Abuse and Mental Health Services Administration, Center for Behavioral Health Statistics and Quality, National Survey on Drug Use and Health, 2015 and 2016, Table 2.20B (https://www.samhsa.gov/data/sites/default/files/NSDUH-DetTabs-2016/NSDUH-DetTabs-2016.pdf).

