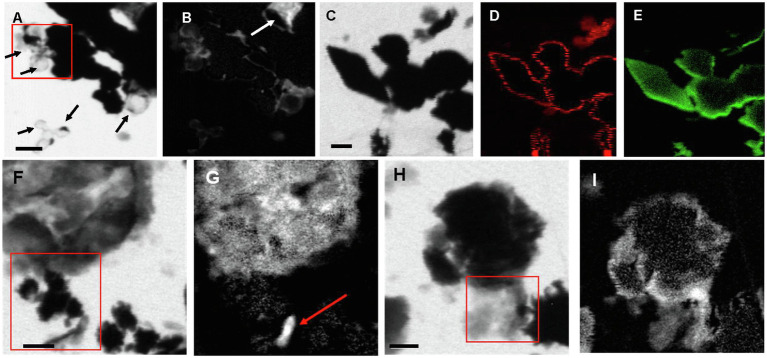
Figure 7.
STXM images and maps of Sulfurovum-dominated streamer biofilm. (A–B) Sample PC1647. (A) image collected at 288.1 eV. Black areas are S(0) particles. The empty spherical envelopes of vaporized S(0) globules are visible (black arrows). (B) Corresponding carbon map. The white arrow shows the carbon enveloped around a partially vaporized S(0) particle (a chain of S(0) bipyramids). (C–I) Sample PC1718. (C) Image collected at 288.2 eV. (D) Carbon map. (E) Sulfur map. (F) Image collected at 300 eV. (G) Carbon map. The arrow points to a rod-shaped microbial cell. (H–I) Image collected at 300 eV. (I) Carbon map. The boxes in (A), (F), and (H) and the arrow in (B) indicate where XANES analyses shown in Figure 8 were performed. Scale bars: 1 μm.

