FIGURE 6.
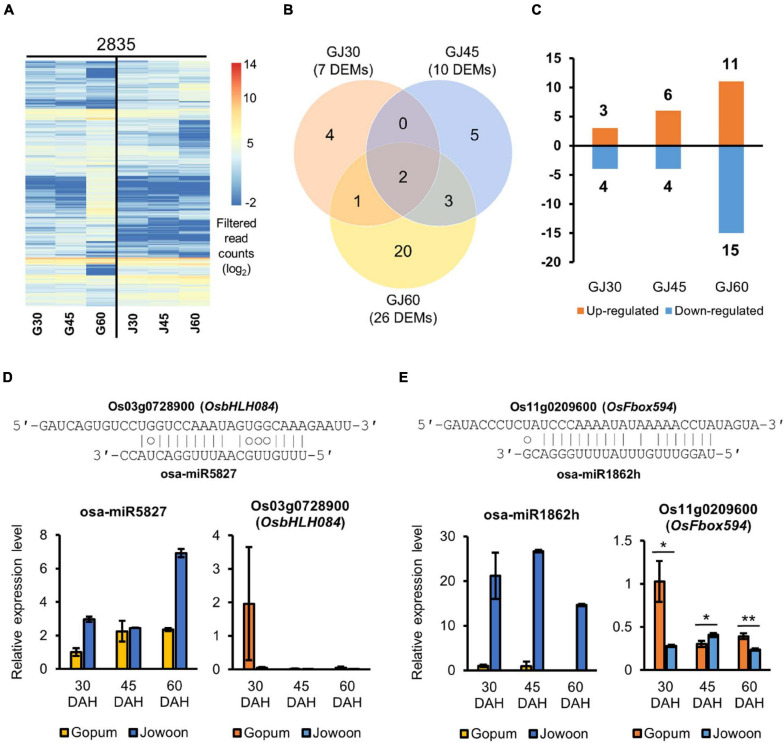
Identification and expression analysis of differentially expressed miRNAs (DEMs) and the corresponding target genes. (A) Heat map of the expressed miRNAs in the embryo of Gopum and Jowoon. Expressed miRNAs, aligned to miRBase and PmiREN, were shown as filtered read counts (log2) values. (B) Comparison of Gopum and Jowoon based on the number of DEMs in the embryo of GJ30, GJ45, and GJ60. (C) Number of miRNAs up- or down-regulated in Jowoon compared with those in Gopum in the embryo of GJ30, GJ45, and GJ60. (D,E) Relative expression levels of miRNAs and corresponding target genes, which were predicted to affect PHS. The pairing between miRNAs and their target genes is indicated. The relative expression levels of genes were validated by qRT-PCR. Data represent mean ± SEM (N = 3). Significance is determined by Student’s t-test, *P < 0.05 and **P < 0.01.

