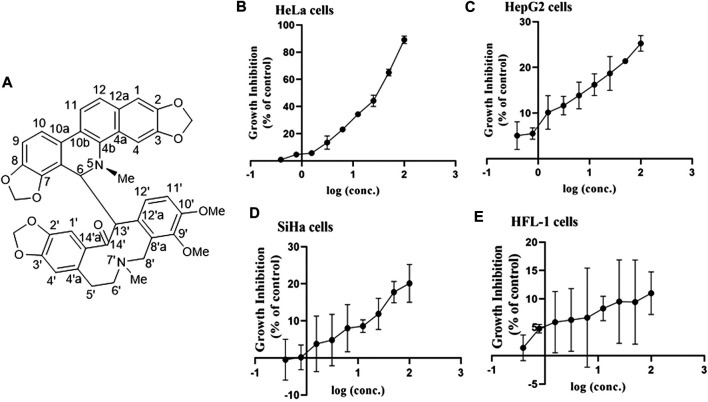
FIGURE 1.
Structure of MA and the association between inhibition of growth and MA concentrations on various cell lines. (A) Structure of MA. (B) HeLa cervical carcinoma cell line. (C) HepG2 liver carcinoma cell line. (D) SiHa cervical carcinoma cell line. (E) HFL-1 normal cell line. Each dot indicates the mean ± SD of triplicate experiments that were evaluated independently.

