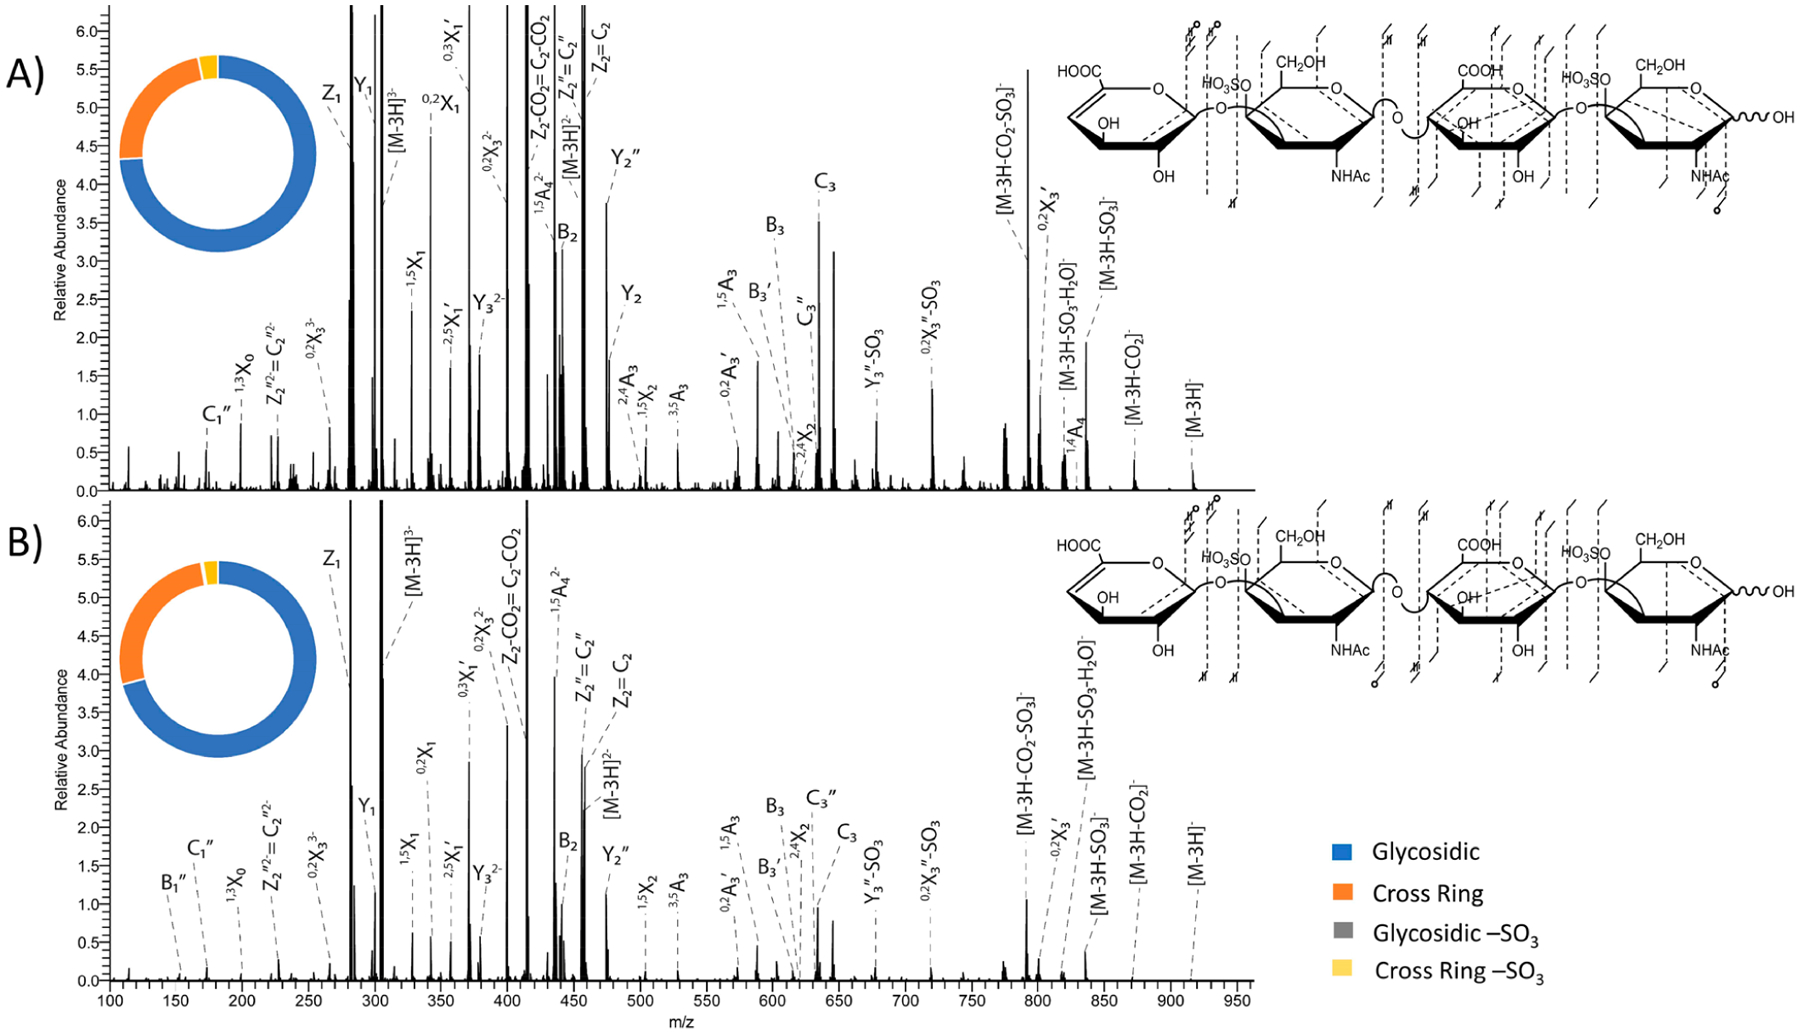
Figure 5.

193 nm UVPD spectra with fragment map and intensity donut plot insets of the [M − 3H]3− precursor of CS-A dp4 with (A) eight laser pulses (4 mJ per pulse) in the high-pressure cell and (B) four laser pulses (4 mJ per pulse) in the high-pressure cell. Donut plots depict intensity distributions of glycosidic fragments (blue), cross-ring fragments (orange), glycosidic fragments with −SO3 loss (gray), and cross-ring fragments with −SO3 loss (yellow).
