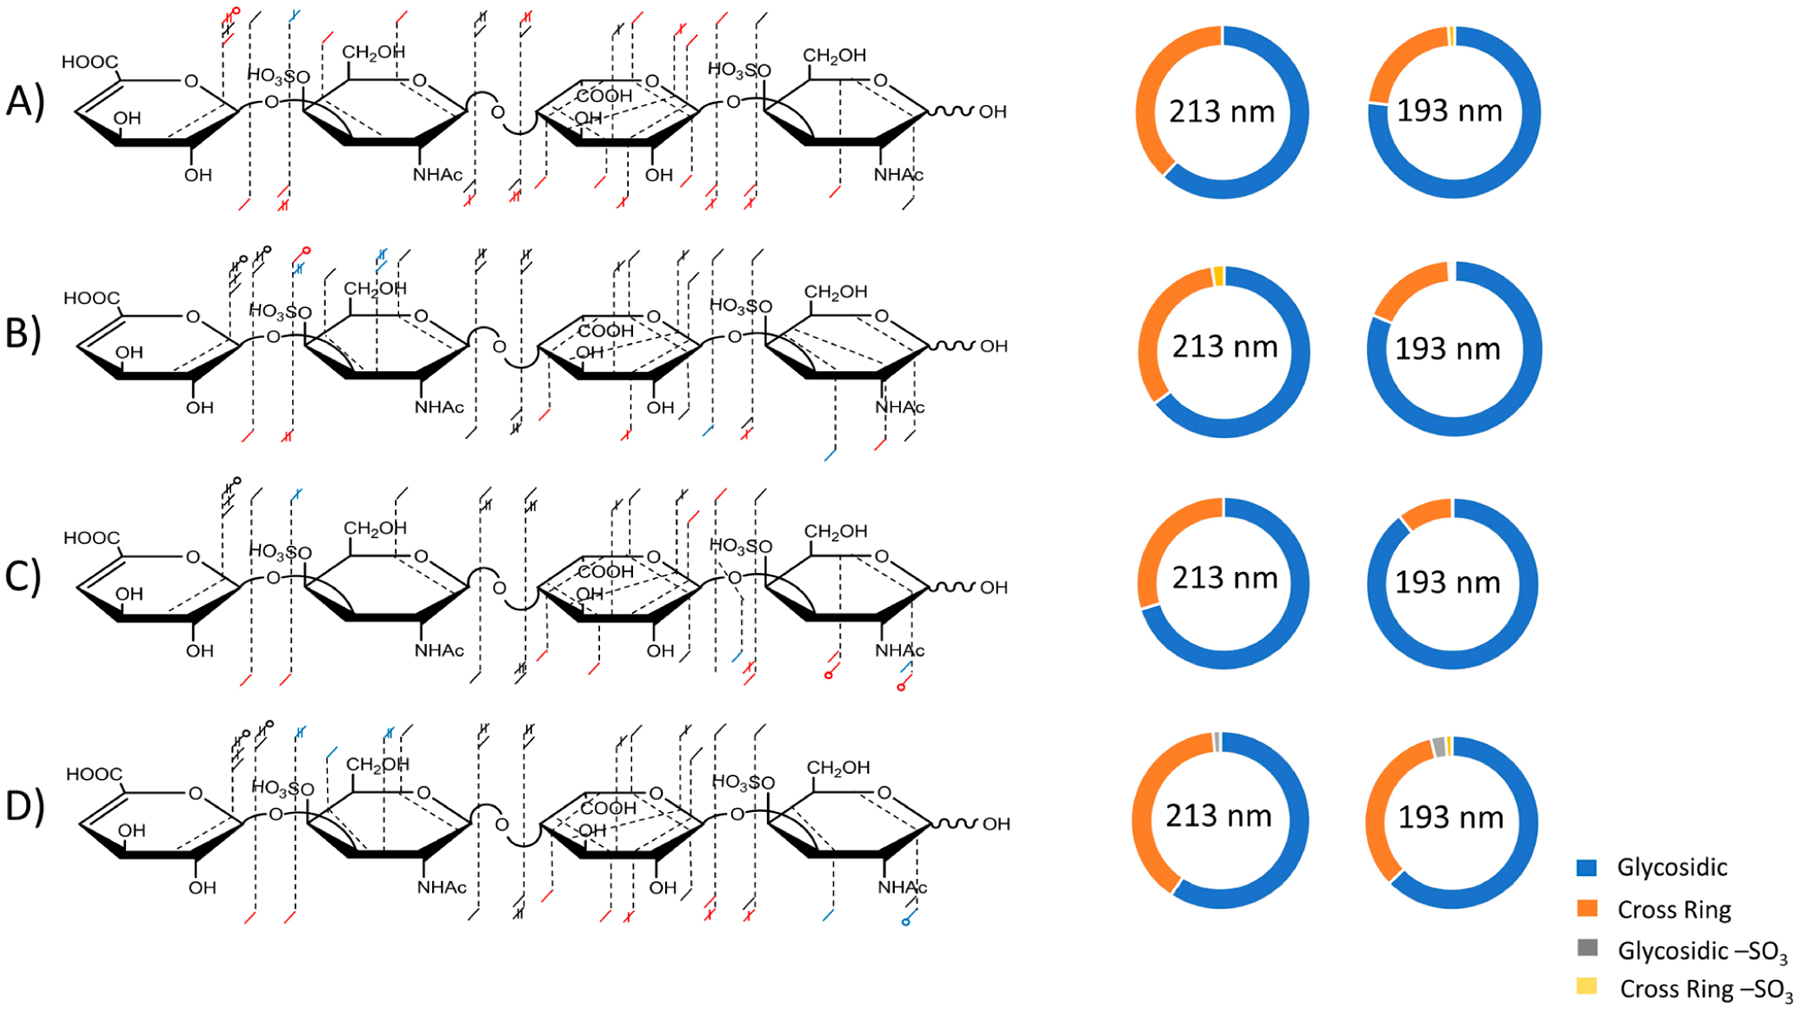
Figure 7.

Annotated fragment maps and donut plots of the [M − 3H]3− precursor of DS dp4 comparing 213 nm UVPD to 193 nm UVPD. Red dashes indicate fragment ions observed solely using 193 nm UVPD, blue dashes indicated fragment ions observed exclusively using 213 nm UVPD, and black dashes indicate fragments produced using 193 nm UVPD or 213 nm UVPD. (A) 213 nm UVPD with 125 pulses (3 μJ/pulse) in the high-pressure cell compared to 193 nm UVPD with four laser pulses (4 mJ/pulse) in the high-pressure cell. (B) 213 nm UVPD with 1000 pulses (3 μJ/pulse) in the high-pressure cell compared to 193 nm UVPD with eight laser pulses (4 mJ/pulse) in the high-pressure cell. (C) 213 nm UVPD with 125 pulses (3 μJ/pulse) in the low-pressure cell compared to 193 nm UVPD with four laser pulses (4 mJ/pulse) in the low-pressure cell. (D) 213 nm UVPD with 1000 pulses (3 μJ/pulse) in the low-pressure cell compared to 193 nm UVPD with eight laser pulses (4 mJ/pulse) in the low-pressure cell.
