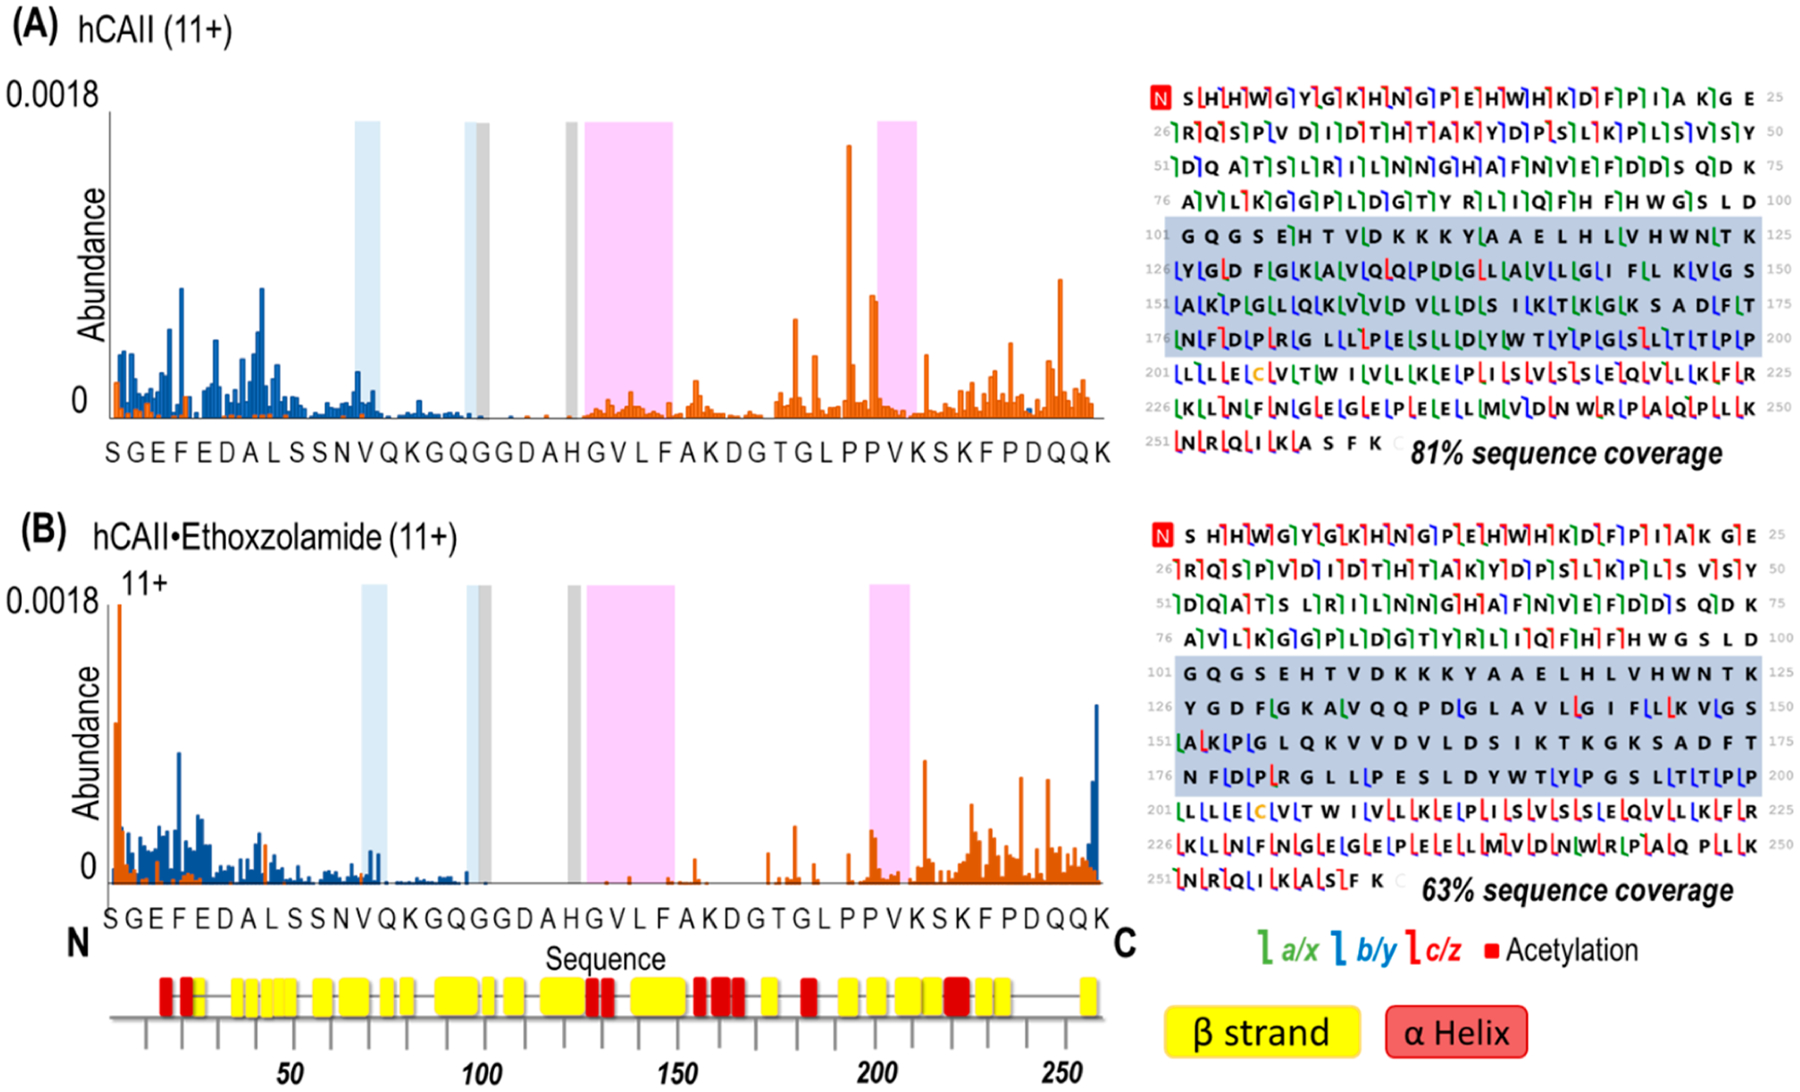
Figure 4.

Backbone cleavage propensity maps (including both apo and holo ions) produced upon UVPD (1 pulse, 2 mJ) of (A) hCAII and (B) hCAII bound to ethoxzolamide and respective sequence coverage maps (left). Backbone cleavages producing C-terminal ions are depicted in orange, and those producing N-terminal ions are depicted in blue. Highlighted are the hydrophobic pocket (pink), the hydrophilic pocket (light blue), and the residues that coordinate zinc (gray). The x-axis shows 1 out of every 6 residues. Shaded regions in the sequence maps highlight decreased sequence coverage for the hCAII complex. β-strands and α-helices are labeled underneath the x-axis using colors corresponding to Figure S1.
