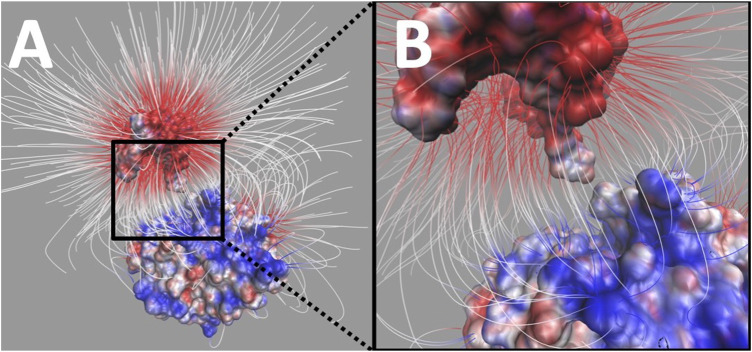
FIGURE 7.
Electrostatic filed lines between DNA and UDG. (A) The overall view of electrostatic filed lines distribution between DNA (top) and UDG (bottom). (B) A closeup of electrostatic field lines distribution between DNA (top) and UDG (bottom) at the interface area. Visual molecular dynamics (VMD) (Kortemme et al., 2004) was implemented based on the electrostatic potential map from DelPhi calculations, and the color scale range was set from −3.0 to 3.0 kT/e. For the better representation of electric field lines, we chose the line size to be four and delta value to be 0.25, and set gradient magnitude value 3.64 (which shows the lines within the volumetric). Besides, those selected field lines for display have the minimum line length of 4.12 and maximum line length of 35.31.

