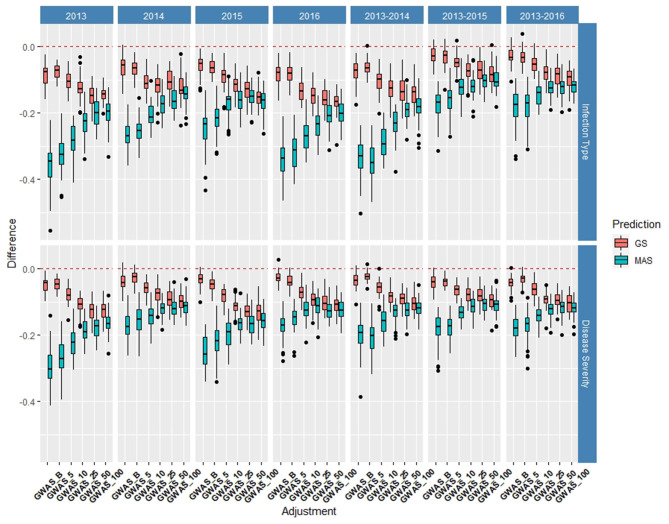
Figure 7.
Difference in prediction accuracy from the base rrBLUP model for de novo GWAS markers in GS and MAS using cross-validations in the diversity panel (DP) lines phenotyped from 2013 to 2016. Adjustments: GWAS_B, GWAS-GS with Bonferonni significant markers; GWAS_5, GWAS-GS with the top five significant markers; GWAS_10, GWAS-GS with the top 10 significant markers; GWAS_25, GWAS-GS with the top 25 significant markers; GWAS_50, GWAS-GS with the top 50 significant markers; GWAS_100, GWAS-GS with the top 100 significant markers.

