
Figure 2.
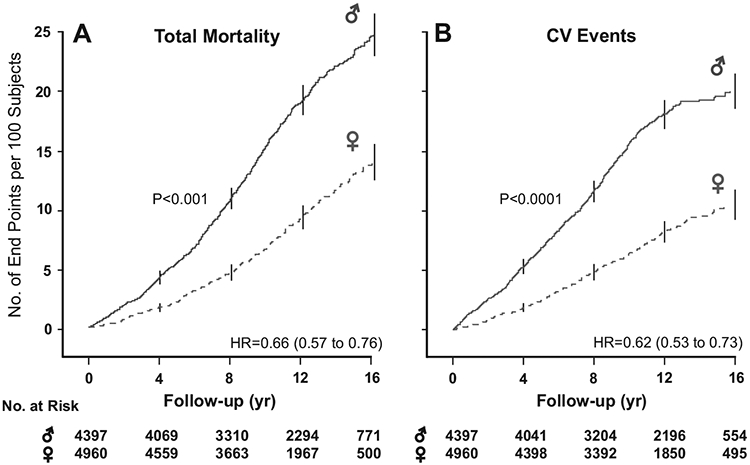
Kaplan-Meier survival function estimates for total mortality (A) and the composite of all fatal plus nonfatal cardiovascular events (B) in 4397 women and 4960 men. Follow-up time spans the 5th to 95th percentile interval. Numbers refer to women and men at risk at the beginning of each 4-year interval. Vertical lines represent the SE of the survival function estimates. HR refers to the hazard ratio, which expresses the risk of women compared with men, with adjustment applied for cohort, age, body mass index, smoking and drinking, serum total cholesterol, history of cardiovascular disease, presence of diabetes mellitus, and antihypertensive drug treatment at baseline.