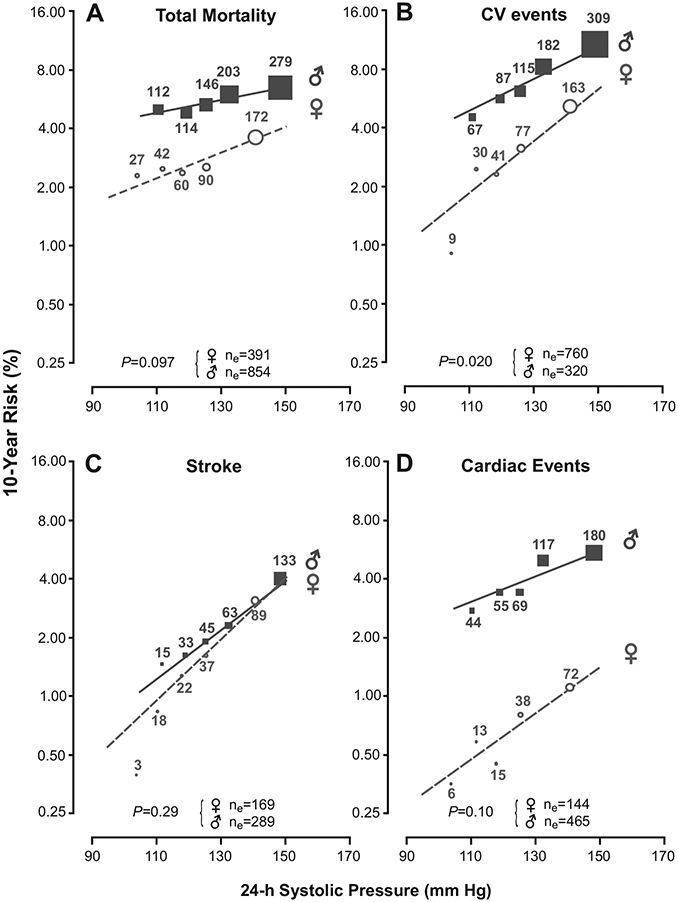
Figure 3.

Absolute 10-year risk of death (A), a composite cardiovascular (CV) end point (B), a fatal or nonfatal stroke (C), or a fatal or nonfatal cardiac event (D) in relation to the 24-hour systolic BP. The continuous risk functions cover the 5th to 95th percentile interval of the 24-hour systolic BP and were fitted by Cox regression with adjustment for cohort, age, body mass index, smoking and drinking, serum total cholesterol, history of cardiovascular disease, presence of diabetes mellitus, and antihypertensive drug treatment at baseline. Circles (women) and squares (men) represent the multivariable-adjusted HRs in quintiles of the distribution of the 24-hour systolic BP and have a size proportional to the inverse of the variance of the HR. The number of events in each quintile is given next to each circle or square; ne is the total number of events by disease category and sex. The probability values for interaction were derived from multivariable-adjusted Cox models as given in Tables 2 and 3.
