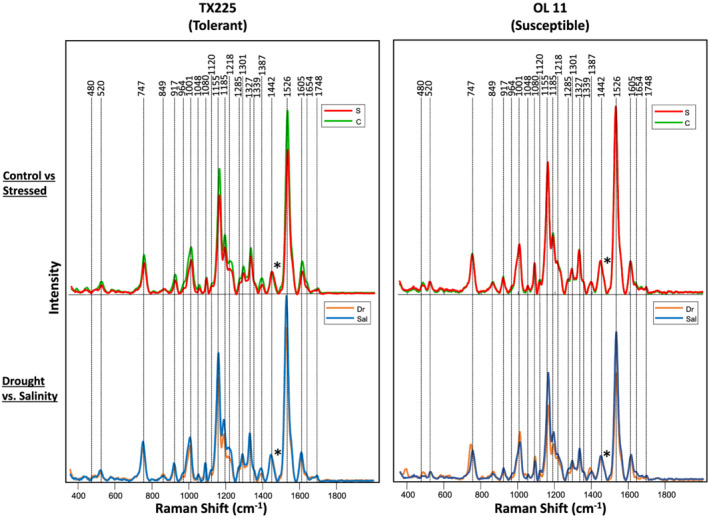
FIGURE 1.

Raman spectra collected from leaves of control (“C”, green) and stressed (average of both drought and salinity stress, “S”, red) peanut lines (top panels). Spectroscopic signatures of water deficit stressed (“Dr”, orange) and salinity stressed (“Sal”, blue) plants (bottom panel). Spectra normalized on CH2 vibrations (1,442 cm−1) present in nearly all classes in biological molecules (marked by asterisks [*])
