
FIGURE 2.
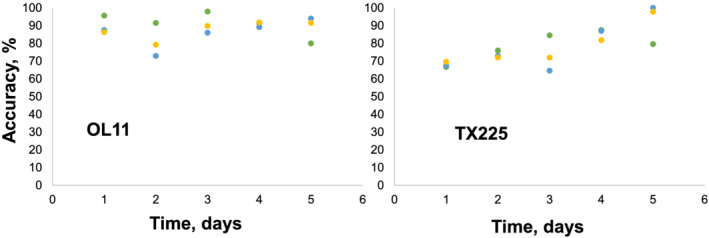
Accuracy of prediction of control (green), water deficit (blue) and salinity (yellow) stresses on susceptible (OL11) and tolerant (TX225) peanut lines
Official websites use .gov
A
.gov website belongs to an official
government organization in the United States.
Secure .gov websites use HTTPS
A lock (
) or https:// means you've safely
connected to the .gov website. Share sensitive
information only on official, secure websites.
Accuracy of prediction of control (green), water deficit (blue) and salinity (yellow) stresses on susceptible (OL11) and tolerant (TX225) peanut lines