
FIGURE 3.
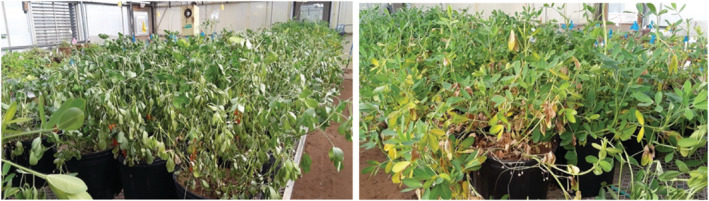
A picture showing plants exhibiting severe water deficit (left) and salinity stress (right) including leaf curing, loss of turgor, and leaf yellowing on Day 5 of sampling
Official websites use .gov
A
.gov website belongs to an official
government organization in the United States.
Secure .gov websites use HTTPS
A lock (
) or https:// means you've safely
connected to the .gov website. Share sensitive
information only on official, secure websites.
A picture showing plants exhibiting severe water deficit (left) and salinity stress (right) including leaf curing, loss of turgor, and leaf yellowing on Day 5 of sampling