Fig. 1.
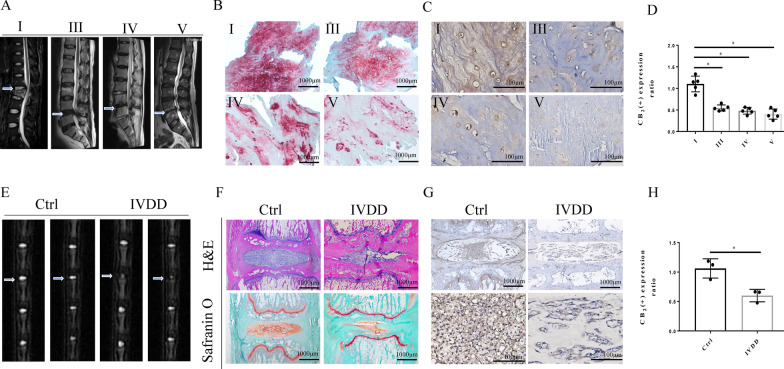
Low expression of CB2 was observed in both human and rat degenerative NP tissue. A Preoperative MRI of participants, who were divided into 4 groups (level: I, III, IV, V) according to the Pfirrmann classification. B Safranin O staining of participant NP tissues; scale bar, 1000 μm. C Representative specimens of immunohistochemical CB2 staining in the 4 separate groups (level: I, III, IV, and V) of participant NP tissues; scale bar, 100 μm. D Quantitative analysis of IHC staining of CB2 (*p < 0.05). E Representative MRI showing the signal intensity of IVD in rats. F H&E and safranin O staining, scale bar, 1000 μm. G Representative specimens of paraffin sections with IHC of CB2 in normal and IVDD rats. H Quantitative analysis of CB2 IHC staining (*p < 0.05). (n = 5 Independent experiments)

