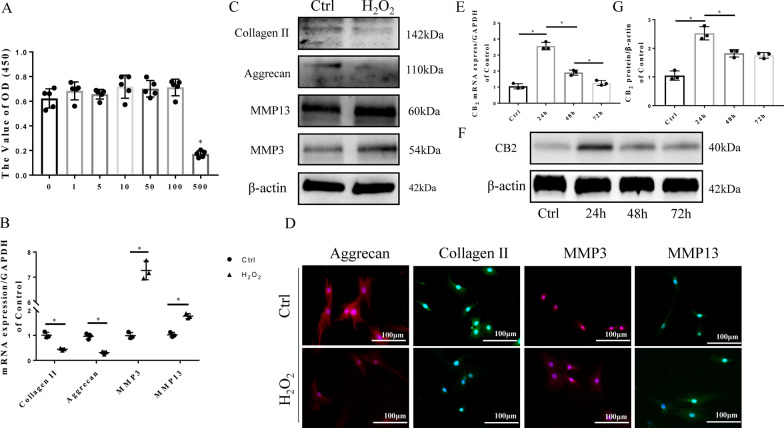
Fig. 2.
H2O2 induces NPC degeneration and affects CB2 expression in NPCs. A CCK-8 results showing that cell viability is not affected by H2O2 at a concentration of 100 µM (*p < 0.05 compared with H2O2 100 µM, 12 h). B RT-qPCR results for aggrecan, collagen II, MMP3 and MMP13 (*p < 0.05). C Western blot results of collagen II, aggrecan, MMP3 and MMP13. D Representative ICC image of collagen II, aggrecan, MMP3 and MMP13; scale bar, 100 μm. E RT-qPCR results of CB2 at different time points after treatment (*p < 0.05). F Western blot results of CB2 at different time points after H2O2 treatment. G Quantitative analysis of the Western blot (* p < 0.05) (n = 3 Independent experiments)

