Fig. 1.
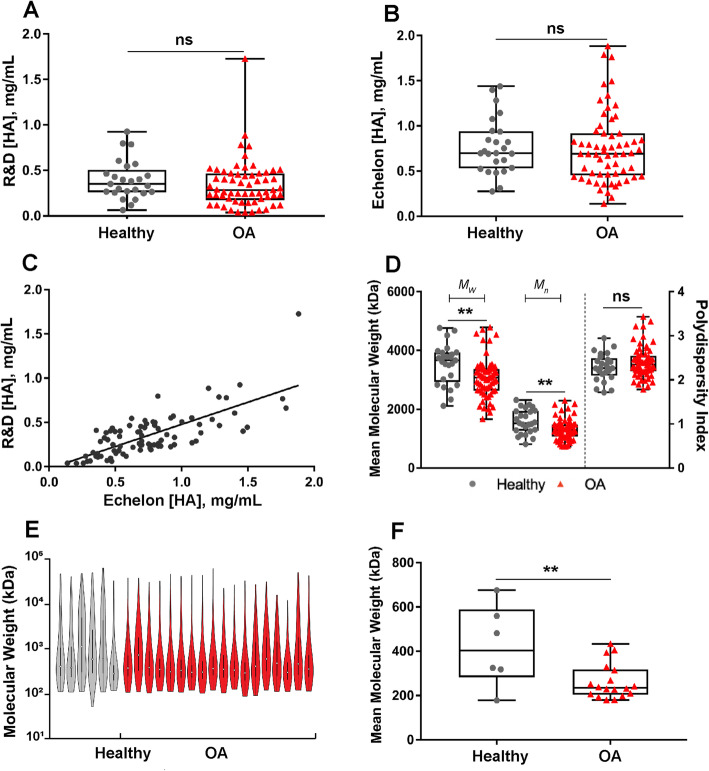
Hyaluronan (HA) molecular weight distribution differed between healthy and OA joints; HA concentration did not. HA concentrations were measured using A a sandwich ELISA and B a competitive ELISA (n = 25 healthy and 61 OA joints). C HA concentrations correlated between ELISAs (R2 = 0.5); however, the competitive ELISA yielded higher concentrations as compared to the sandwich ELISA. D HA molecular weights were measured by agarose gel electrophoresis and weight average molecular weight (Mw), number average molecular weight (Mn), and polydispersity index (Mw/Mn) were calculated for each sample. Both Mw and Mn were significantly decreased in OA versus healthy samples, while there was no significant difference in PDI between the two groups. E HA molecular weight distribution and F mean molecular weight of HA in a subset of OA (n = 18) and healthy (n = 6) samples measured by SS-nanopore. Mean molecular weight was significantly decreased in OA samples as compared to healthy samples. ns, not significant; P > 0.05. **P < 0.01. Data (A, B, D, F) are displayed as box-and-whisker plots representing the first and third quartiles, median, and spread of data for healthy and OA samples

