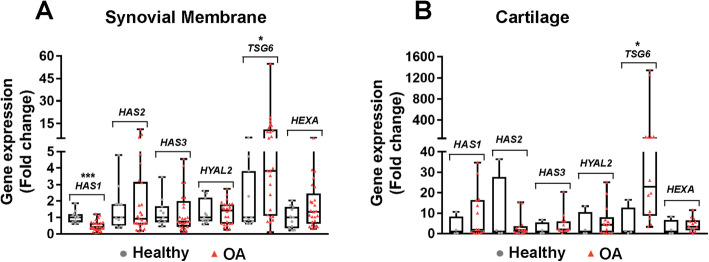
Fig. 4.
TSG6 gene expression was increased in synovial membrane and cartilage from OA joints. Gene expression of hyaluronan synthases (HAS1, HAS2, HAS3), hyaluronidases and hexosaminadases (HYAL2 and HEXA), and TSG6 were detected by qRT-PCR (OA, osteoarthritis). Gene expression is reported as 2−∆∆CT where ∆CT = CT (gene of interest) – CT (18S rRNA), ∆∆CT = (individual ∆C T) – healthy ∆CT average and calculated as 2−∆∆CT. A Synovial membrane (n = 11 healthy and n = 25 OA) and B cartilage (n = 4 healthy and n = 14 OA) gene expression. *P < 0.05 , ****P < 0.0001. Data are displayed as box-and-whisker plots representing the first and third quartiles, median, and range of fold change gene expression levels for healthy and OA samples

