Fig. 2.
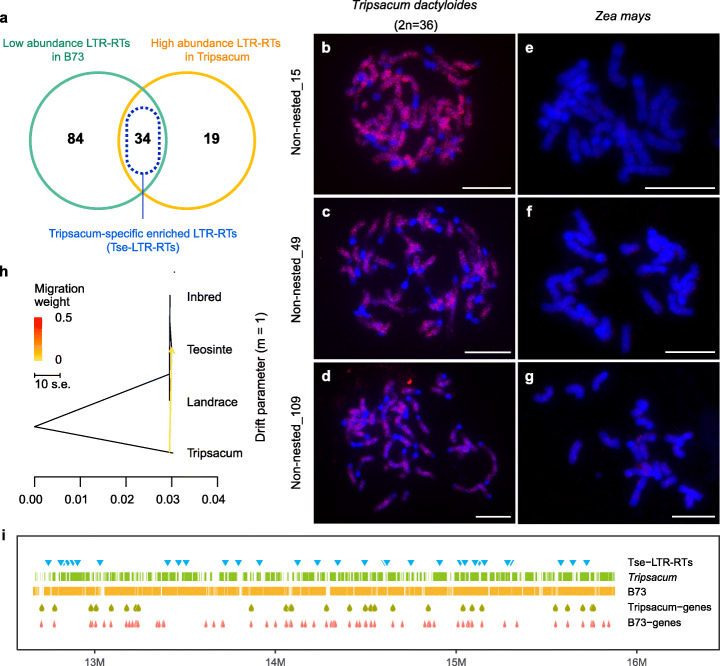
RegionA is enriched with Tripsacum-specific LTR retrotransposons. a Venn diagram of different types of LTR-RTs in RegionA. The intersection (blue dotted frame) of low abundance LTR-RTs in B73 and high abundance LTR-RT in Tripsacum represent Tripsacum-specific enriched LTR-RTs (Tse-LTR-RTs). b–g FISH analysis of the distribution of three Tripsacum-specific enriched LTR retrotransposons (Tse-LTR-RTs) cloned from RegionA, all three Tse-LTR-RTs showed genome-wide distribution in Tripsacum dactyloides (2n = 36) (b–d), while they had no obvious signal in Zea mays (e–g). Scale bars = 10 μm. h Gene flow detected between Tripsacum and Zea in RegionA. One migration event was set for analysis (m = 1), direction of gene flow was indicated by an arrow. i Schematic Structure of LTRs and genes in RegionA. Rows from top to bottom indicate location of Tse-LTR-RTs; read coverage of Tripsacum and B73; location of Tripsacum consistent genes and B73 annotation genes, respectively

