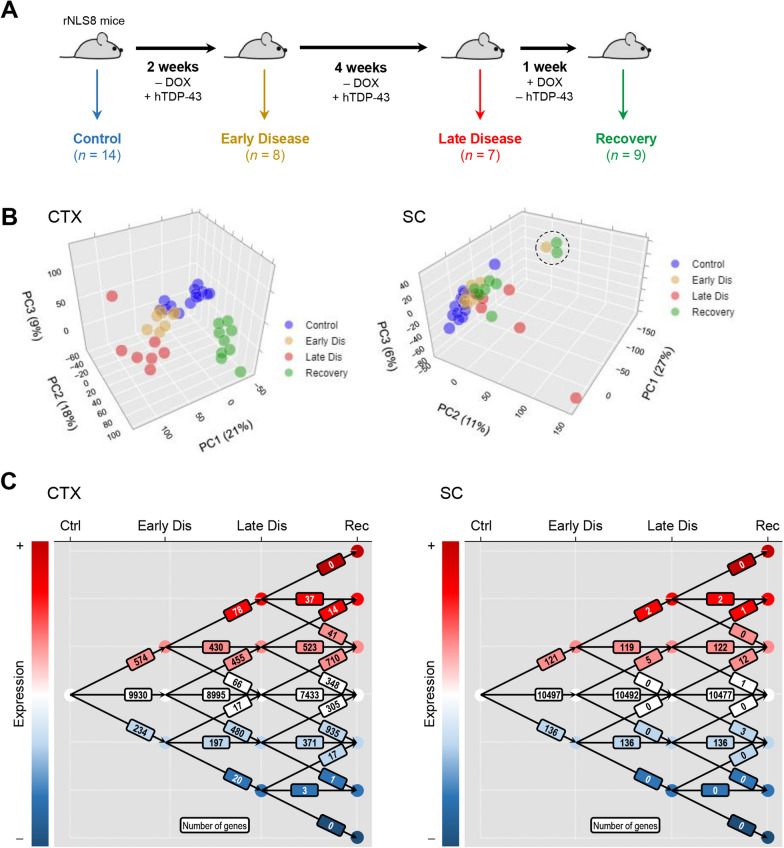
Fig. 1.
Longitudinal gene expression changes throughout disease progression and recovery in rNLS8 mice. A Study schema. B Principal component analysis of transcriptomic data (as quantile-normalized, log2-transformed FPKM) obtained for microglia isolated from the cortex (left panel) or spinal cord (right panel) of control mice or animals in early disease, late disease and recovery phases. Scores for the first three principal components are represented in three-dimensional scatter plots, where data points correspond to microglial isolates from individual animals and the fraction of total variance explained by each principal component is denoted in axis labels. Principal component analysis used unit variance scaling and singular value decomposition with imputation. The three circled datapoints are outlying samples excluded from the principal component analysis shown in Additional file 1: Figure S2, though these samples were not excluded from any other analyses in this study. C Longitudinal topography of differentially expressed genes (Benjamini–Hochberg adjusted P < 0.05; log2-fold change > 0.5) in microglia isolated from the cortex (left panel) or spinal cord (right panel) of animals over the course of disease progression and recovery. The number of genes showing increased expression (upward vectors), unchanged expression (lateral vectors), and decreased expression (downward vectors) at each disease stage transition is illustrated

