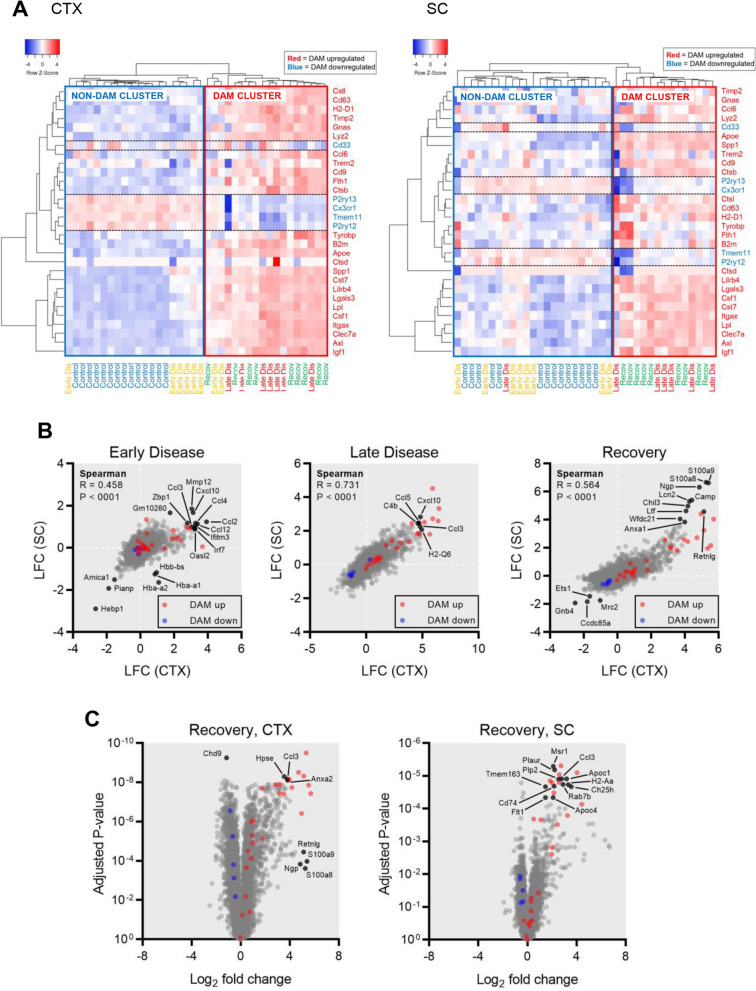
Fig. 2.
Altered expression of genes not in the DAM signature in microglia isolated from rNLS8 mice. A Unsupervised hierarchical clustering of microglia isolates from the cortex (left panel) or spinal cord (right panel) according to the expression values (normalized to row Z-scores as depicted in the heatmap scales) of canonical DAM genes. The reported direction of expression changes under neurodegenerative conditions is represented by the color coding of row labels. Two distinct sample clusters, a ‘non-DAM cluster’ containing all control and most early disease samples, and the ‘DAM cluster’ containing all recovery and most late disease isolates, are demarcated in the heatmaps. Clustering used the ward.D method with Euclidean distance. B Scatter plots of log2 fold change values derived from the comparison of early disease (left panel), late disease (middle panel) and recovery microglia (right panel) to control microglia in the cortex and spinal cord. Spearman correlation metrics are denoted as an assessment of the consistency of microglial gene expression changes between these two anatomical sites. Canonical DAM genes reported to be upregulated under neurodegenerative conditions are marked in red, whereas canonically downregulated DAM genes are marked in blue. C Volcano plots illustrating the magnitude (as log2 fold change) and statistical significance (as Benjamini–Hochberg adjusted P-values) of changes in the expression of individual genes in microglia at recovery relative to control microglia isolated from the cortex (left panel) or spinal cord (right panel). Canonical DAM genes reported to be upregulated under neurodegenerative conditions are marked in red, whereas canonically downregulated DAM genes are marked in blue

