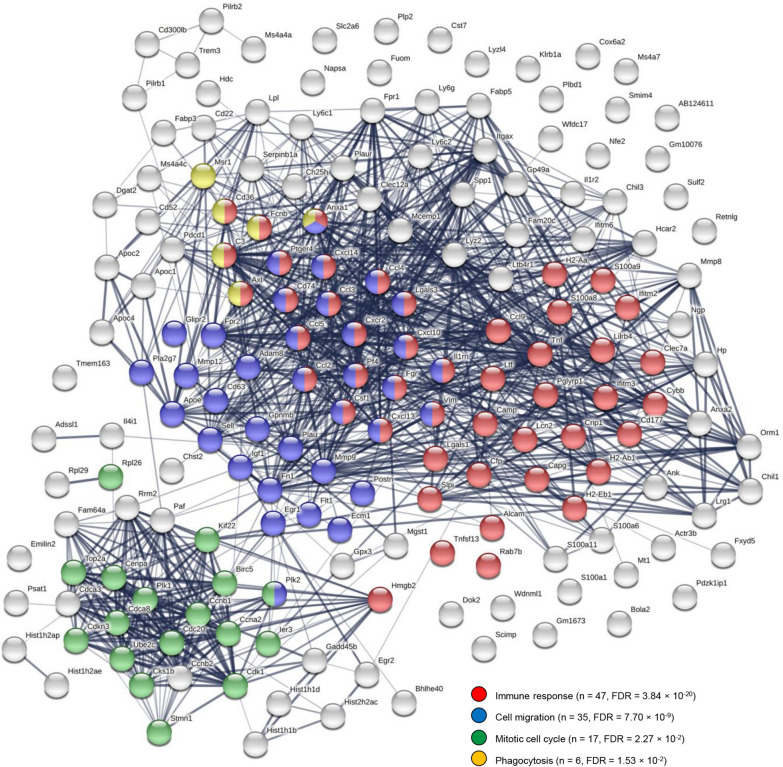
Fig. 6.
Protein–protein interaction network among genes showing increased expression in recovery-phase relative to control microglia isolated from the spinal cord. The network was generated from genes differentially expressed with LFC ≥ 1 and FDR < 0.05. The number of edges in the network (n = 1031) was significantly greater than expected in a random gene sample of the same order (expected n = 300, p < 10–16). The network was enriched for proteins functioning in immune response (FDR = 3.84 × 10⁻²⁰), cell migration (FDR = 7.70 × 10⁻⁹), the mitotic cell cycle (FDR = 2.27 × 10⁻²), and phagocytosis (FDR = 1.53 × 10⁻²), among other gene ontology annotations. The network was generated using STRING (https://string-db.org)

